Difference between revisions of "Zaqar/Performance/PubSub/Redis"
(→Maximum Latency) |
(Added remaining C3 scenarios and grouped graphs for different configs together to make comparisons easier) |
||
| Line 68: | Line 68: | ||
''Note 2: The load generator's CPUs were close to saturation at the maximum load levels tested below. To drive larger configurations and/or push the servers to the point that requests begin timing out, zaqar-bench will need to be extended to support multiple load generator boxes. That being said, what is shown below is certainly not without value.'' | ''Note 2: The load generator's CPUs were close to saturation at the maximum load levels tested below. To drive larger configurations and/or push the servers to the point that requests begin timing out, zaqar-bench will need to be extended to support multiple load generator boxes. That being said, what is shown below is certainly not without value.'' | ||
| − | == | + | == Configurations == |
| − | In these tests, varying amounts of load was applied to the following | + | In these tests, varying amounts of load was applied to the following configurations: |
| + | |||
| + | === Configuration 1 (C1) === | ||
* 1x4 load balancer (1x box, 4x worker procs) | * 1x4 load balancer (1x box, 4x worker procs) | ||
| Line 79: | Line 81: | ||
** Similar results should be obtainable with much more modest hardware for the catalog DB. | ** Similar results should be obtainable with much more modest hardware for the catalog DB. | ||
** Alternatively, an RDBMs could be used here (Zaqar supports both MongoDB and SQLAlchemy catalog drivers) | ** Alternatively, an RDBMs could be used here (Zaqar supports both MongoDB and SQLAlchemy catalog drivers) | ||
| + | |||
| + | === Configuration 2 (C2) === | ||
| + | |||
| + | Same as Configuration 1 but adds an additional web head (2x20) | ||
| + | |||
| + | === Configuration 3 (C3) === | ||
| + | |||
| + | Same as Configuration 2 but adds an additional redis proc (1x2) | ||
| + | |||
| + | == Scenarios == | ||
=== Senario 1 (Read-Heavy)=== | === Senario 1 (Read-Heavy)=== | ||
| Line 87: | Line 99: | ||
The Y-axis denotes mean latency in milliseconds. | The Y-axis denotes mean latency in milliseconds. | ||
| + | |||
| + | C1 | ||
[[File:Zaqar-juno-redis-pubsub-latency-mean-increasing-obs-50-prod.png|700px]] | [[File:Zaqar-juno-redis-pubsub-latency-mean-increasing-obs-50-prod.png|700px]] | ||
| − | + | C2 | |
| − | + | [[File:Zaqar-juno-redis-pubsub-c2-latency-mean-increasing-obs-50-prod.png|700px]] | |
| − | |||
| − | [[File:Zaqar-juno-redis-pubsub- | ||
| − | + | C3 | |
| − | + | [[File:Zaqar-juno-redis-pubsub-c3-latency-mean-increasing-obs-50-prod.png|700px]] | |
| − | + | ==== Combined Throughput ==== | |
| − | + | The Y-axis denotes the combined throughput (req/sec) for all clients. | |
| − | + | C1 | |
| − | [[File:Zaqar-juno-redis-pubsub- | + | [[File:Zaqar-juno-redis-pubsub-throughput-increasing-obs-50-prod.png|700px]] |
| − | + | C2 | |
| − | + | [[File:Zaqar-juno-redis-pubsub-c2-throughput-increasing-obs-50-prod.png|700px]] | |
| − | + | C3 | |
| − | + | [[File:Zaqar-juno-redis-pubsub-c3-throughput-increasing-obs-50-prod.png|700px]] | |
| − | + | ==== Standard Deviation ==== | |
| − | + | The Y-axis denotes the standard deviation for per-request latency (ms). Even at small loads there were a few outliers, sitting outside the 99th percentile, that bumped up the stdev. Further experimentation is needed to find the root cause, whether it be in the client, the server, or the Redis instance. | |
| − | + | C1 | |
| − | [[File:Zaqar-juno-redis-pubsub- | + | [[File:Zaqar-juno-redis-pubsub-stdev-increasing-obs-50-prod.png|700px]] |
| − | + | C2 | |
| − | + | [[File:Zaqar-juno-redis-pubsub-c2-stdev-increasing-obs-50-prod.png|700px]] | |
| − | |||
| − | [[File:Zaqar-juno-redis-pubsub- | ||
| − | |||
| − | |||
| − | + | C3 | |
| − | [[File:Zaqar-juno-redis-pubsub-stdev-increasing- | + | [[File:Zaqar-juno-redis-pubsub-c3-stdev-increasing-obs-50-prod.png|700px]] |
==== 99th Percentile ==== | ==== 99th Percentile ==== | ||
| Line 140: | Line 148: | ||
The Y-axis denotes the per-request latency (ms) for 99% of client requests. In other words, 99% of requests completed within the given time duration. | The Y-axis denotes the per-request latency (ms) for 99% of client requests. In other words, 99% of requests completed within the given time duration. | ||
| − | + | C1 | |
| − | + | [[File:Zaqar-juno-redis-pubsub-99p-increasing-obs-50-prod.png|700px]] | |
| − | + | C2 | |
| − | [[File:Zaqar-juno-redis-pubsub- | + | [[File:Zaqar-juno-redis-pubsub-c2-99p-increasing-obs-50-prod.png|700px]] |
| − | + | C3 | |
| − | + | [[File:Zaqar-juno-redis-pubsub-c3-99p-increasing-obs-50-prod.png|700px]] | |
| − | ==== | + | ==== Maximum Latency ==== |
| − | The Y-axis | + | The Y-axis represents the maximum latency (ms) experienced by any client during a given run. Comparing this graph to the 99th percentile gives a rough idea re what sort of outliers were in the population. Note that the spikes may be due to Redis's snapshotting feature (TBD). |
| − | + | C1 | |
| − | + | [[File:Zaqar-juno-redis-pubsub-latency-max-increasing-obs-50-prod.png|700px]] | |
| − | + | C2 | |
| − | [[File:Zaqar-juno-redis-pubsub- | + | [[File:Zaqar-juno-redis-pubsub-c2-latency-max-increasing-obs-50-prod.png|700px]] |
| − | + | C3 | |
| − | + | [[File:Zaqar-juno-redis-pubsub-c3-latency-max-increasing-obs-50-prod.png|700px]] | |
| − | + | === Senario 2 (Write-Heavy)=== | |
| − | + | In these tests, observers were held at 50 while the number of producer clients was steadily increased. The X-axis denotes the total number of clients (producers + observers). Each level of load was executed for 5 minutes, after which the samples were used to calculate the following statistics. | |
| − | + | ==== Mean Latency ==== | |
| − | + | The Y-axis denotes mean latency in milliseconds. | |
| − | + | C1 | |
| − | + | [[File:Zaqar-juno-redis-pubsub-latency-mean-increasing-prod-50-obs.png|700px]] | |
| − | + | C2 | |
| − | + | [[File:Zaqar-juno-redis-pubsub-c2-latency-mean-increasing-prod-50-obs.png|700px]] | |
| − | + | C3 | |
| − | + | [[File:Zaqar-juno-redis-pubsub-c3-latency-mean-increasing-prod-50-obs.png|700px]] | |
| − | |||
| − | |||
| − | |||
| − | |||
| − | |||
| − | |||
| − | === | + | ==== Combined Throughput ==== |
| − | + | The Y-axis denotes the combined throughput (req/sec) for all clients. | |
| − | + | C1 | |
| − | + | [[File:Zaqar-juno-redis-pubsub-throughput-increasing-prod-50-obs.png|700px]] | |
| − | + | C2 | |
| − | + | [[File:Zaqar-juno-redis-pubsub-c2-throughput-increasing-prod-50-obs.png|700px]] | |
| − | + | C3 | |
| − | [[File:Zaqar-juno-redis-pubsub- | + | [[File:Zaqar-juno-redis-pubsub-c3-throughput-increasing-prod-50-obs.png|700px]] |
==== Standard Deviation ==== | ==== Standard Deviation ==== | ||
| Line 214: | Line 216: | ||
The Y-axis denotes the standard deviation for per-request latency (ms). Even at small loads there were a few outliers, sitting outside the 99th percentile, that bumped up the stdev. Further experimentation is needed to find the root cause, whether it be in the client, the server, or the Redis instance. | The Y-axis denotes the standard deviation for per-request latency (ms). Even at small loads there were a few outliers, sitting outside the 99th percentile, that bumped up the stdev. Further experimentation is needed to find the root cause, whether it be in the client, the server, or the Redis instance. | ||
| − | + | C1 | |
| − | + | [[File:Zaqar-juno-redis-pubsub-stdev-increasing-prod-50-obs.png|700px]] | |
| − | + | C2 | |
| − | [[File:Zaqar-juno-redis-pubsub-c2- | + | [[File:Zaqar-juno-redis-pubsub-c2-stdev-increasing-prod-50-obs.png|700px]] |
| − | + | C3 | |
| − | + | [[File:Zaqar-juno-redis-pubsub-c3-stdev-increasing-prod-50-obs.png|700px]] | |
| − | + | ==== 99th Percentile ==== | |
| − | + | The Y-axis denotes the per-request latency (ms) for 99% of client requests. In other words, 99% of requests completed within the given time duration. | |
| − | + | C1 | |
| − | + | [[File:Zaqar-juno-redis-pubsub-99p-increasing-prod-50-obs.png|700px]] | |
| − | + | C2 | |
| − | [[File:Zaqar-juno-redis-pubsub-c2- | + | [[File:Zaqar-juno-redis-pubsub-c2-99p-increasing-prod-50-obs.png|700px]] |
| − | + | C3 | |
| − | + | [[File:Zaqar-juno-redis-pubsub-c3-99p-increasing-prod-50-obs.png|700px]] | |
| − | + | ==== Maximum Latency ==== | |
| − | + | The Y-axis represents the maximum latency (ms) experienced by any client during a given run. Comparing this graph to the 99th percentile gives a rough idea re what sort of outliers were in the population. Note that the spikes may be due to Redis's snapshotting feature (TBD). | |
| − | |||
| − | The Y-axis | ||
| − | + | C1 | |
| − | + | [[File:Zaqar-juno-redis-pubsub-latency-max-increasing-prod-50-obs.png|700px]] | |
| − | + | C2 | |
| − | [[File:Zaqar-juno-redis-pubsub-c2- | + | [[File:Zaqar-juno-redis-pubsub-c2-latency-max-increasing-prod-50-obs.png|700px]] |
| − | + | C3 | |
| − | + | [[File:Zaqar-juno-redis-pubsub-c3-latency-max-increasing-prod-50-obs.png|700px]] | |
| − | |||
| − | [[File:Zaqar-juno-redis-pubsub- | ||
=== Senario 3 (Balanced)=== | === Senario 3 (Balanced)=== | ||
| Line 270: | Line 268: | ||
The Y-axis denotes mean latency in milliseconds. | The Y-axis denotes mean latency in milliseconds. | ||
| − | [[File:Zaqar-juno-redis-pubsub | + | C1 |
| + | |||
| + | [[File:Zaqar-juno-redis-pubsub-latency-mean-balanced.png|700px]] | ||
| − | + | C2 | |
| − | + | [[File:Zaqar-juno-redis-pubsub-c2-latency-mean-balanced.png|700px]] | |
| − | + | C3 | |
| − | + | [[File:Zaqar-juno-redis-pubsub-c3-latency-mean-balanced.png|700px]] | |
| − | + | ==== Combined Throughput ==== | |
| − | + | The Y-axis denotes the combined throughput (req/sec) for all clients. | |
| − | + | C1 | |
| − | + | [[File:Zaqar-juno-redis-pubsub-throughput-balanced.png|700px]] | |
| − | + | C2 | |
| − | + | [[File:Zaqar-juno-redis-pubsub-c2-throughput-balanced.png|700px]] | |
| − | + | C3 | |
| − | [[File:Zaqar-juno-redis-pubsub- | + | [[File:Zaqar-juno-redis-pubsub-c3-throughput-balanced.png|700px]] |
| − | == | + | ==== Standard Deviation ==== |
| − | + | The Y-axis denotes the standard deviation for per-request latency (ms). Even at small loads there were a few outliers, sitting outside the 99th percentile, that bumped up the stdev. Further experimentation is needed to find the root cause, whether it be in the client, the server, or the Redis instance. | |
| − | + | C1 | |
| − | |||
| − | |||
| − | |||
| − | |||
| − | |||
| − | |||
| − | + | [[File:Zaqar-juno-redis-pubsub-stdev-balanced.png|700px]] | |
| − | + | C2 | |
| − | + | [[File:Zaqar-juno-redis-pubsub-c2-stdev-balanced.png|700px]] | |
| − | + | C3 | |
| − | + | [[File:Zaqar-juno-redis-pubsub-c3-stdev-balanced.png|700px]] | |
| − | + | ==== 99th Percentile ==== | |
| − | + | The Y-axis denotes the per-request latency (ms) for 99% of client requests. In other words, 99% of requests completed within the given time duration. | |
| − | + | C1 | |
| − | + | [[File:Zaqar-juno-redis-pubsub-99p-balanced.png|700px]] | |
| − | + | C2 | |
| − | + | [[File:Zaqar-juno-redis-pubsub-c2-99p-balanced.png|700px]] | |
| − | + | C3 | |
| − | [[File:Zaqar-juno-redis-pubsub-c3- | + | [[File:Zaqar-juno-redis-pubsub-c3-99p-balanced.png|700px]] |
| − | ==== | + | ==== Maximum Latency ==== |
| − | The Y-axis | + | The Y-axis represents the maximum latency (ms) experienced by any client during a given run. Comparing this graph to the 99th percentile gives a rough idea of what sort of outliers were in the population. Note that the spikes may be due to Redis's snapshotting feature (TBD). |
| − | + | C1 | |
| − | + | [[File:Zaqar-juno-redis-pubsub-latency-max-balanced.png|700px]] | |
| − | + | C2 | |
| − | [[File:Zaqar-juno-redis-pubsub- | + | [[File:Zaqar-juno-redis-pubsub-c2-latency-max-balanced.png|700px]] |
| − | + | C3 | |
| − | + | [[File:Zaqar-juno-redis-pubsub-c3-latency-max-balanced.png|700px]] | |
Revision as of 21:39, 16 September 2014
Contents
Overview
These tests examined the pub-sub performance of the Redis driver (Juno release).
- zaqar-bench for load generation and stats
- 5 minute test duration at each load level
- ~1K messages, 60-sec TTL
- 4 queues (messages distributed evenly)
Servers
- Load Balancer
- Hardware
- 1x Intel Xeon E5-2680 v2 2.8Ghz
- 32 GB RAM
- 10Gbps NIC
- 32GB SATADOM
- Software
- Ubuntu 14.04
- Nginx 1.4.6 (conf)
- Hardware
- Load Generator
- Hardware
- 1x Intel Xeon E5-2680 v2 2.8Ghz
- 32 GB RAM
- 10Gbps NIC
- 32GB SATADOM
- Software
- Ubuntu 14.04
- Python 2.7.6
- zaqar-bench (patched)
- Hardware
- Web Head
- Hardware
- 1x Intel Xeon E5-2680 v2 2.8Ghz
- 32 GB RAM
- 10Gbps NIC
- 32GB SATADOM
- Software
- Ubuntu 14.04
- Python 2.7.6
- zaqar server @ab3a4fb1
- pooling=true
- storage=mongodb (pooling catalog)
- uWSGI 2.0.7 + gevent 1.0.1 (conf)
- Hardware
- Redis
- Hardware
- 2x Intel Xeon E5-2680 v2 2.8Ghz
- 32 GB RAM
- 10Gbps NIC
- 2x LSI Nytro WarpDrive BLP4-1600
- Software
- Ubuntu 14.04
- Redis 2.8.4
- Default config except snapshot only once very 15 minutes
- Hardware
- MongoDB
- Hardware
- 2x Intel Xeon E5-2680 v2 2.8Ghz
- 32 GB RAM
- 10Gbps NIC
- 2x LSI Nytro WarpDrive BLP4-1600
- Software
- Debian 7
- MongoDB 2.6.4
- Default config, except setting replSet and enabling periodic logging of CPU and I/O
- Hardware
Note 1: CPU usage on the web head and Redis box was lower for the same amounts of load used in the pilot test. It is unclear how much of this was due to Ubuntu 14.04 vs. Debian 7, newer versions of uWSGI, Python, and Redis, or some other factor. The configurations used for the aforementioned software was very similar.
Note 2: The load generator's CPUs were close to saturation at the maximum load levels tested below. To drive larger configurations and/or push the servers to the point that requests begin timing out, zaqar-bench will need to be extended to support multiple load generator boxes. That being said, what is shown below is certainly not without value.
Configurations
In these tests, varying amounts of load was applied to the following configurations:
Configuration 1 (C1)
- 1x4 load balancer (1x box, 4x worker procs)
- 1x20 web head (1x box, 20x worker procs)
- 1x1 redis (1x box, 1x redis proc)
- 3x mongo nodes (single replica set) for the pooling catalog
- This is very much overkill for the catalog store, but it was already set up from a previous test, and so was reused in the interest of time.
- Similar results should be obtainable with much more modest hardware for the catalog DB.
- Alternatively, an RDBMs could be used here (Zaqar supports both MongoDB and SQLAlchemy catalog drivers)
Configuration 2 (C2)
Same as Configuration 1 but adds an additional web head (2x20)
Configuration 3 (C3)
Same as Configuration 2 but adds an additional redis proc (1x2)
Scenarios
Senario 1 (Read-Heavy)
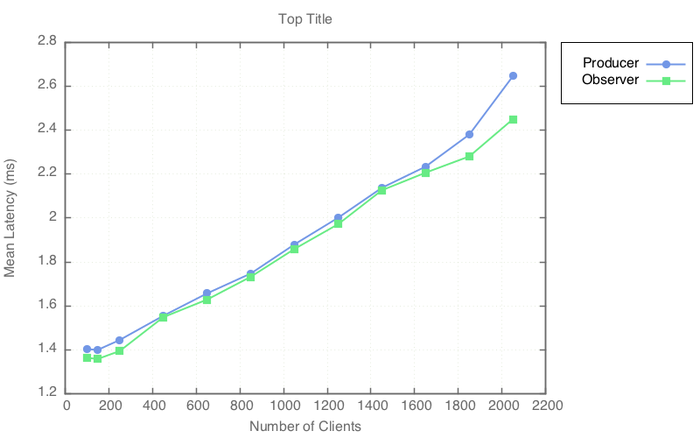
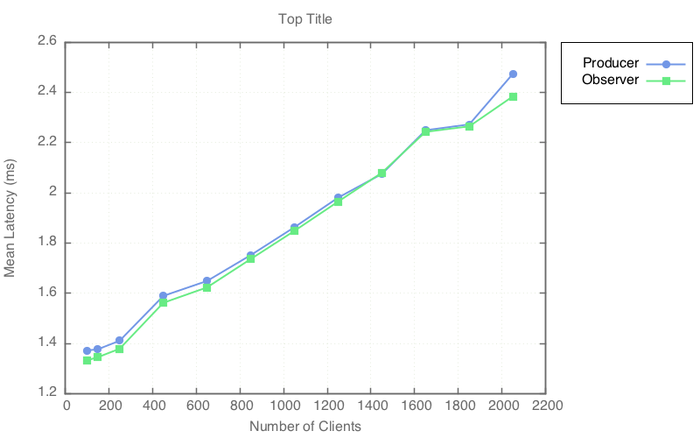
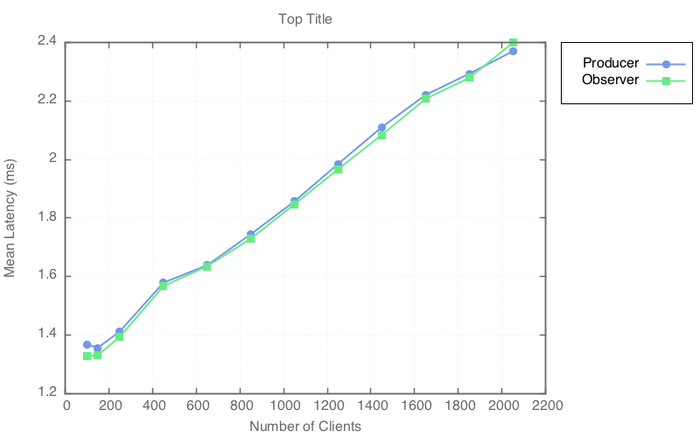
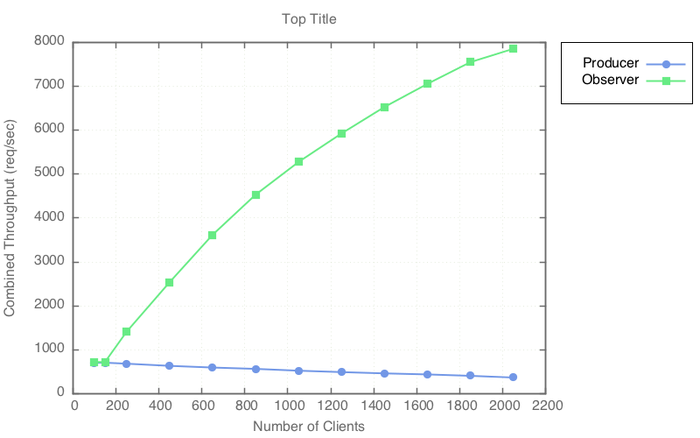
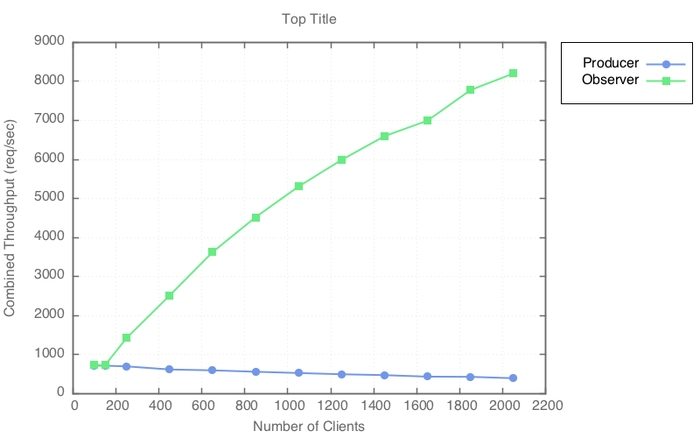
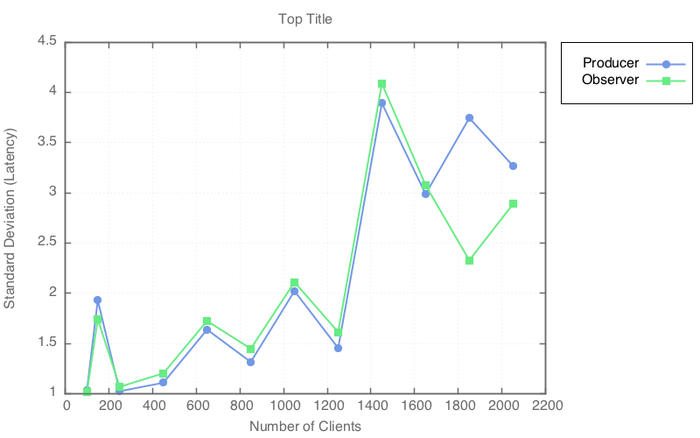
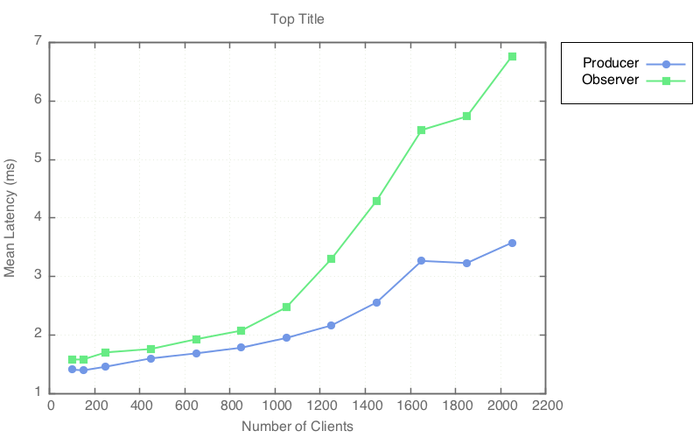
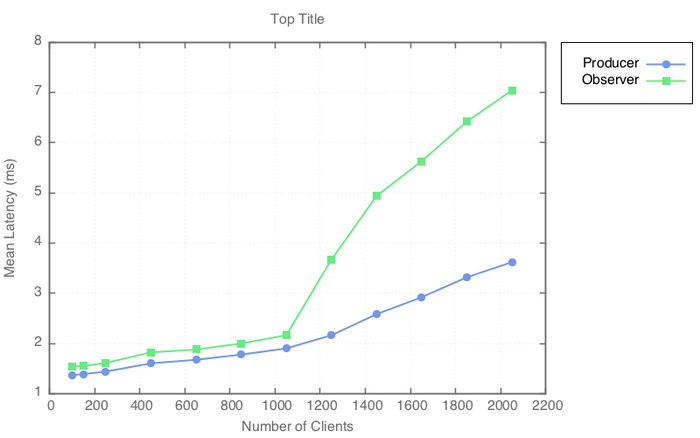
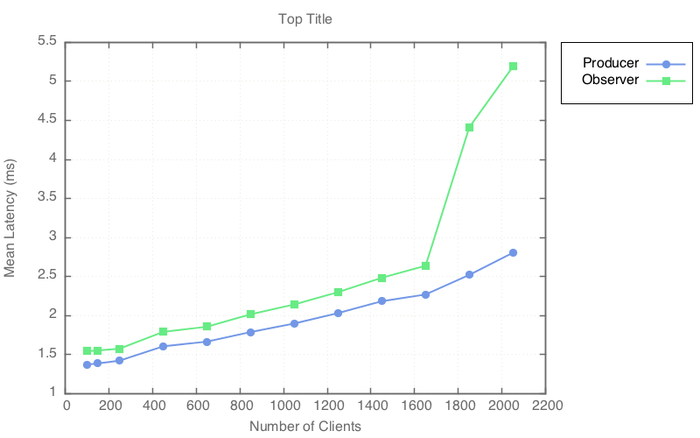
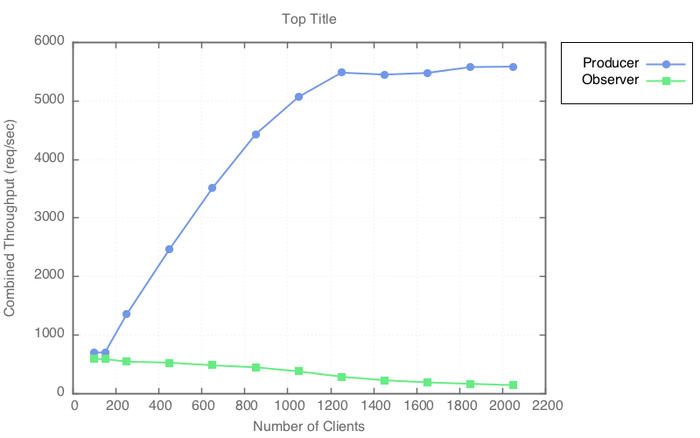
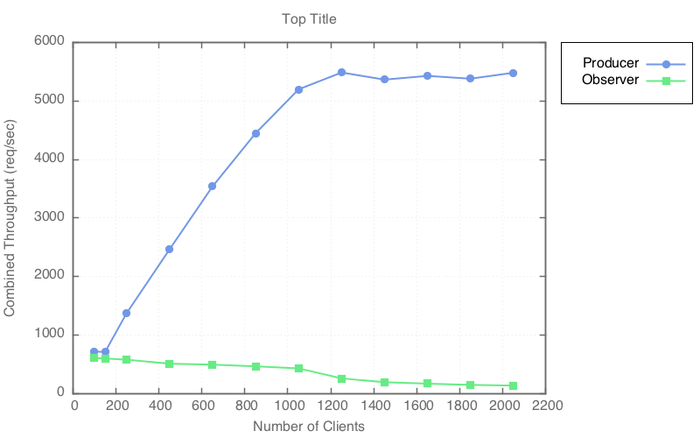
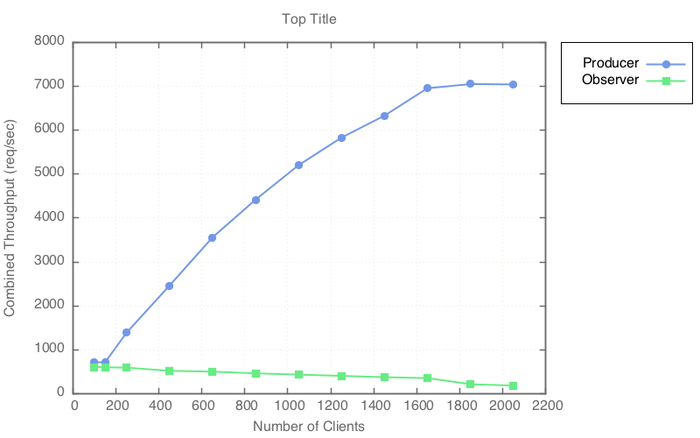
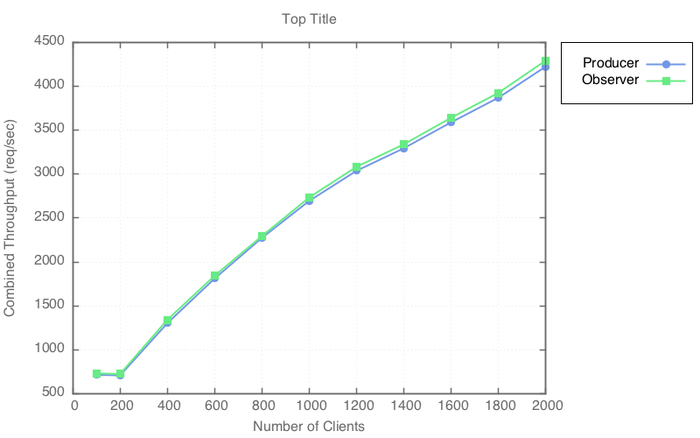
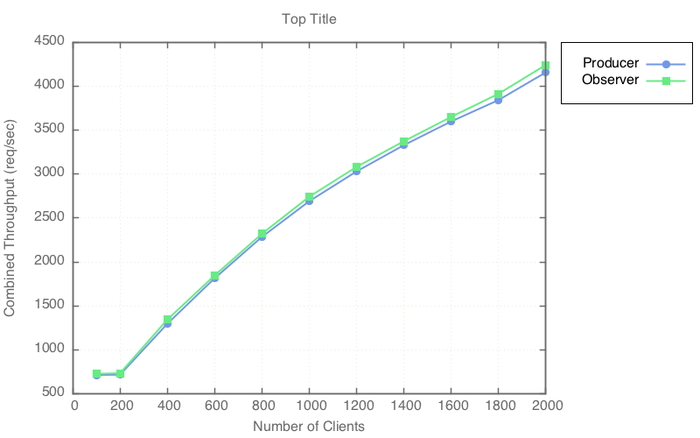
In these tests, producers were held at 50 while the number of observer clients was steadily increased. The X axis denotes the total number of observers and producers. For some use cases that Zaqar targets, the number of observers polling the API far exceeds the number of messages being posted at any given time.
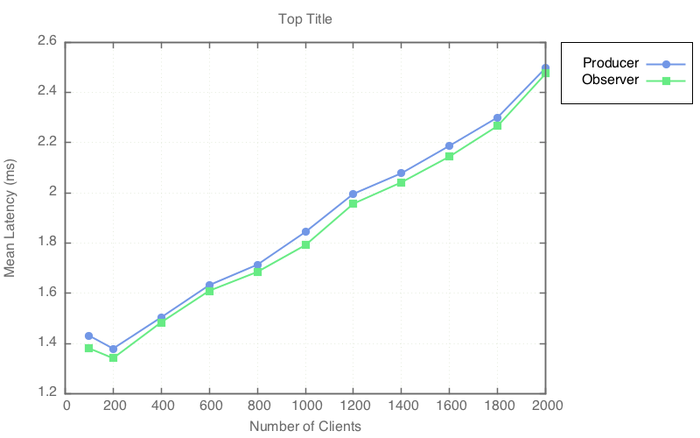
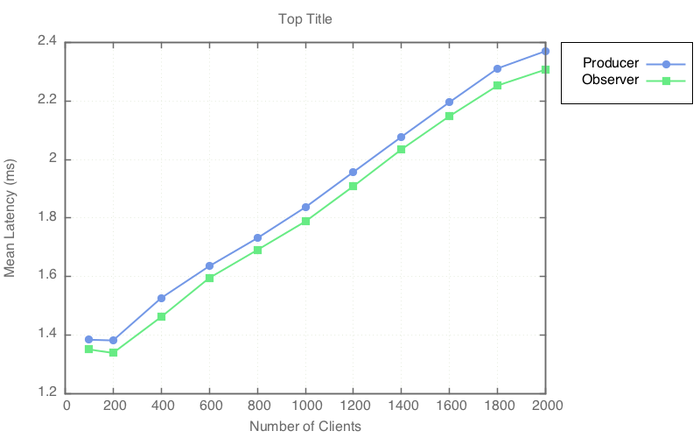
Mean Latency
The Y-axis denotes mean latency in milliseconds.
C1
C2
C3
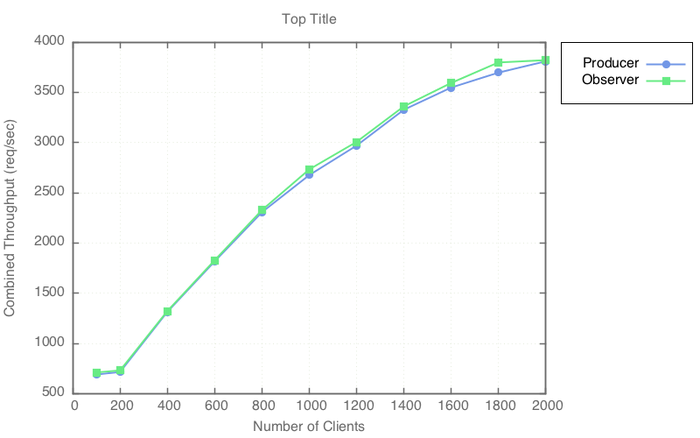
Combined Throughput
The Y-axis denotes the combined throughput (req/sec) for all clients.
C1
C2
C3
Standard Deviation
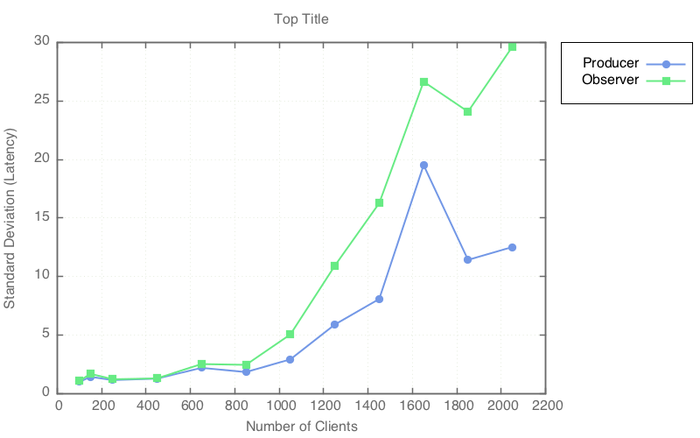
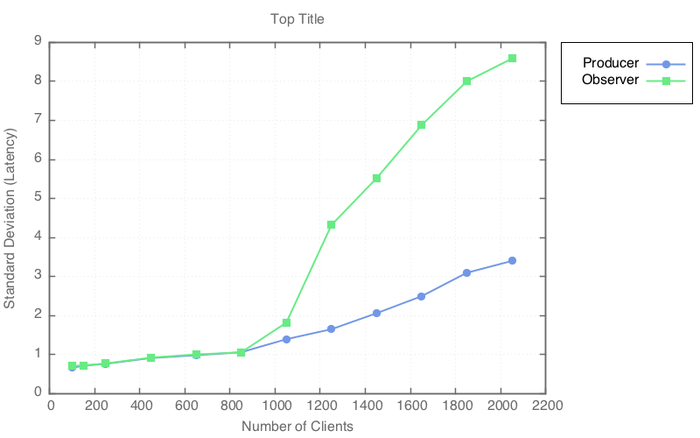
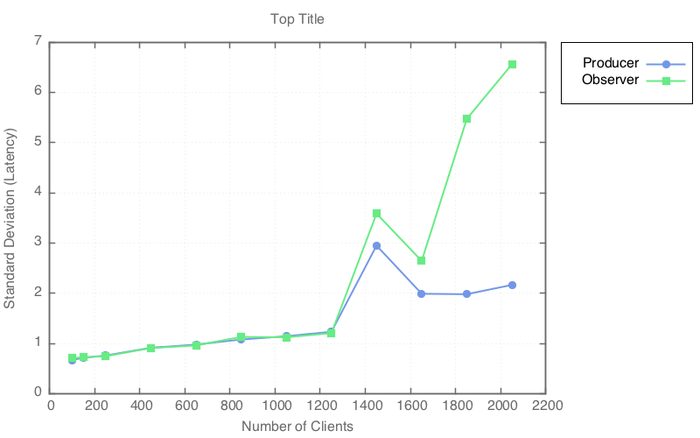
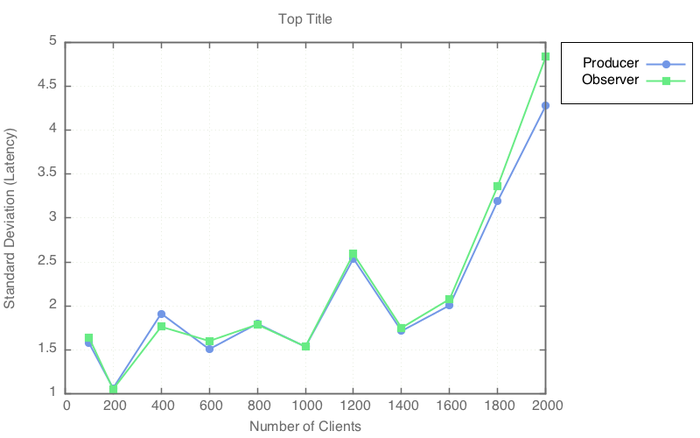
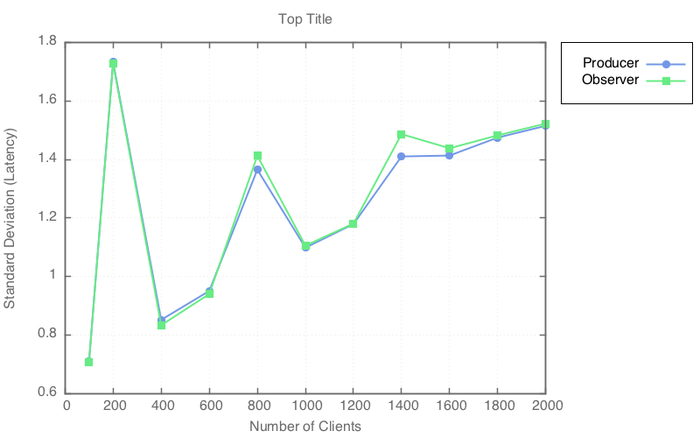
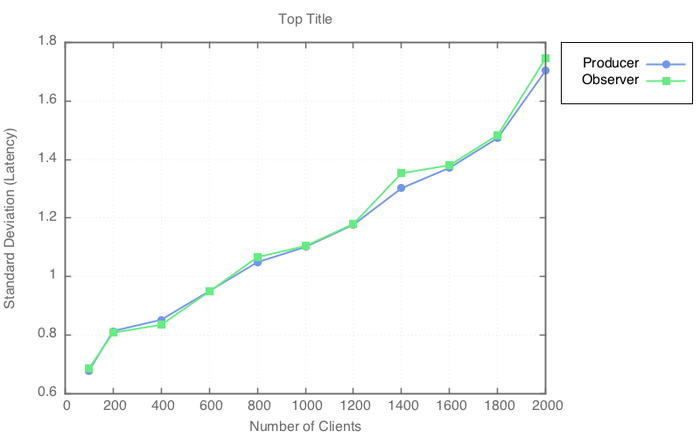
The Y-axis denotes the standard deviation for per-request latency (ms). Even at small loads there were a few outliers, sitting outside the 99th percentile, that bumped up the stdev. Further experimentation is needed to find the root cause, whether it be in the client, the server, or the Redis instance.
C1
C2
C3
99th Percentile
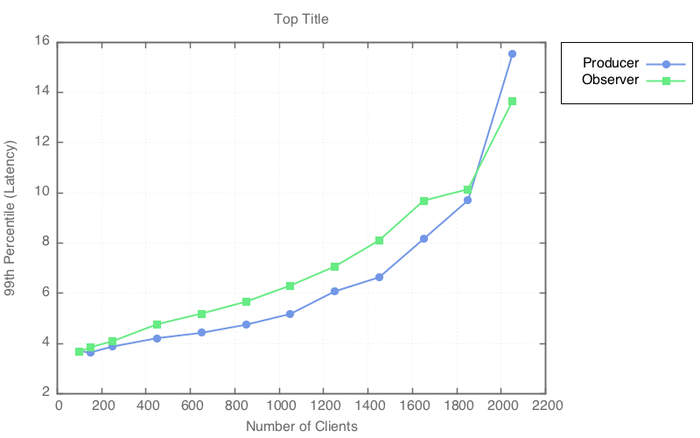
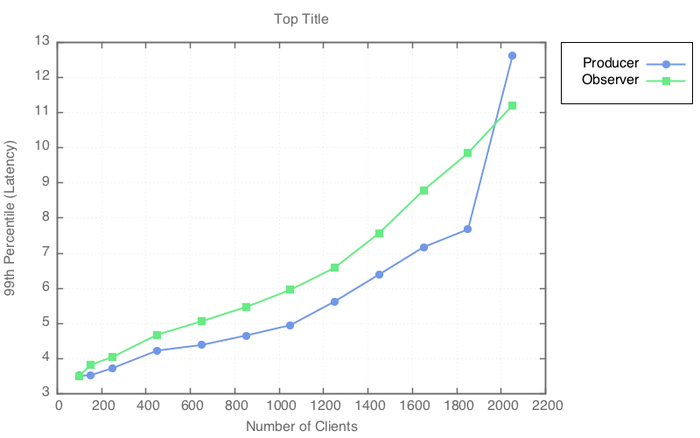
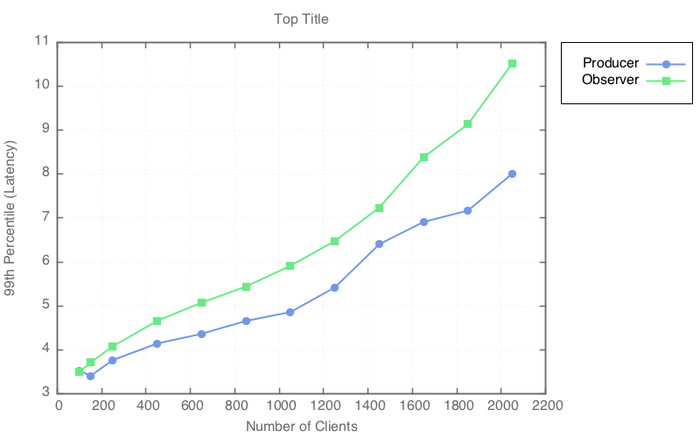
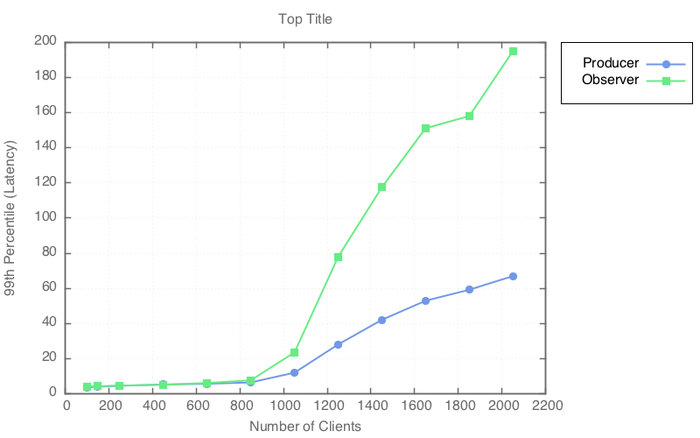
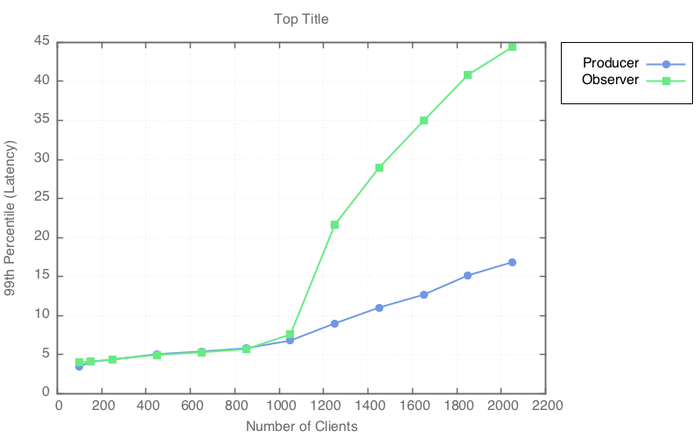
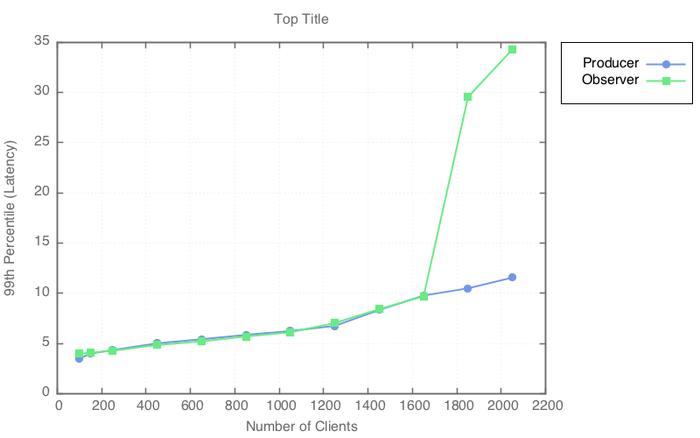
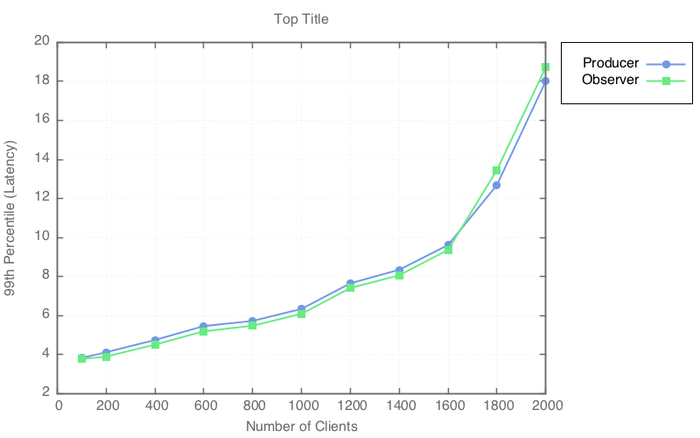
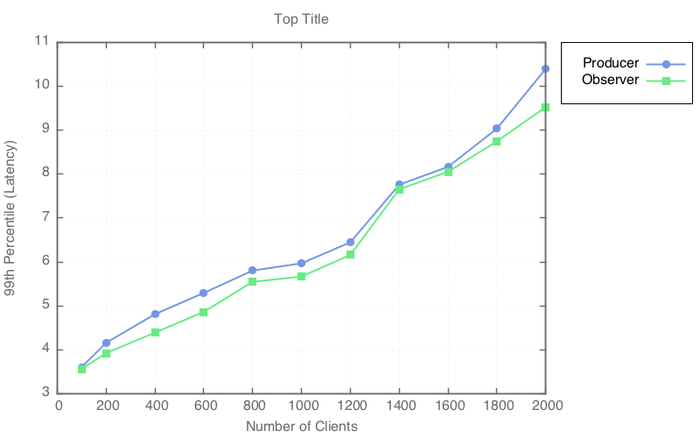
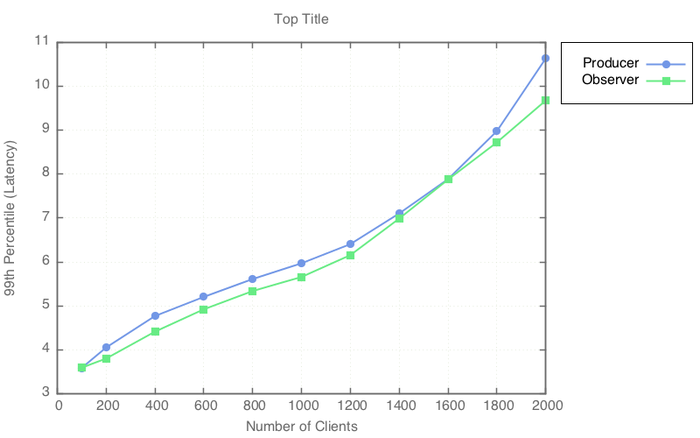
The Y-axis denotes the per-request latency (ms) for 99% of client requests. In other words, 99% of requests completed within the given time duration.
C1
C2
C3
Maximum Latency
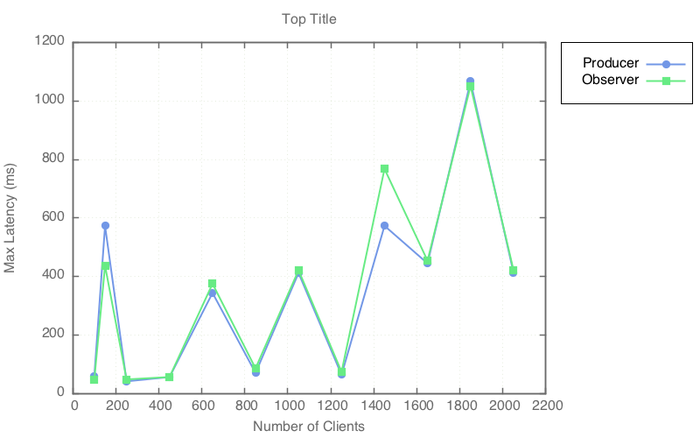
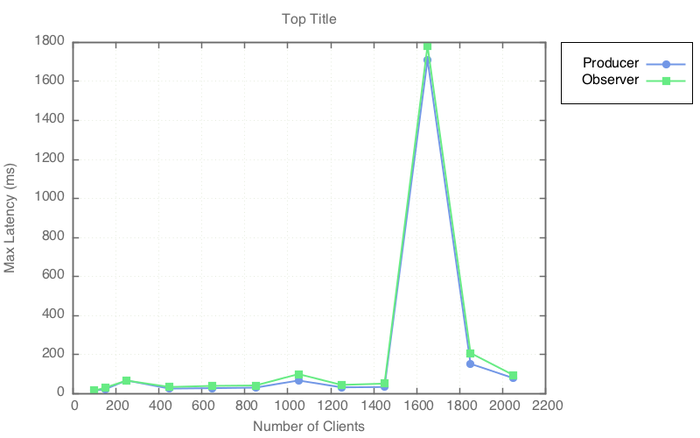
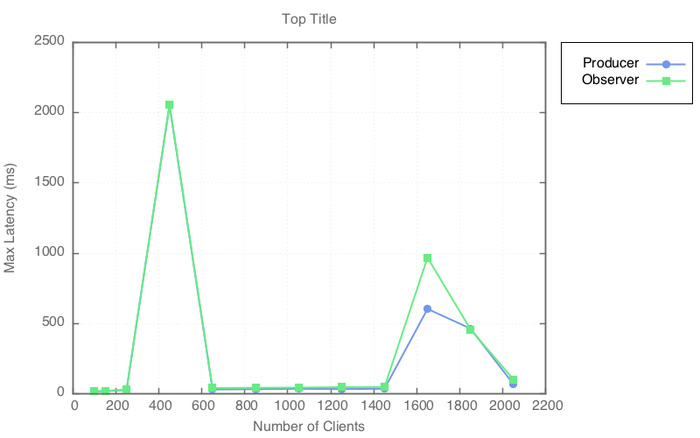
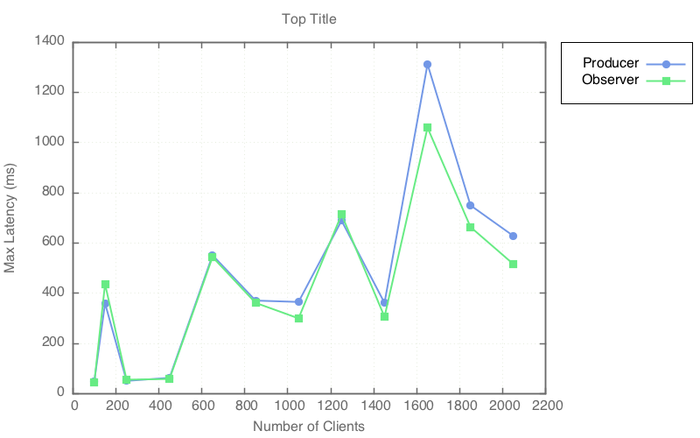
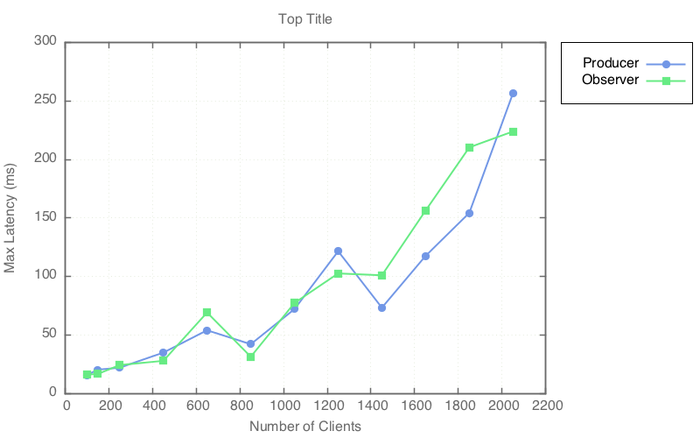
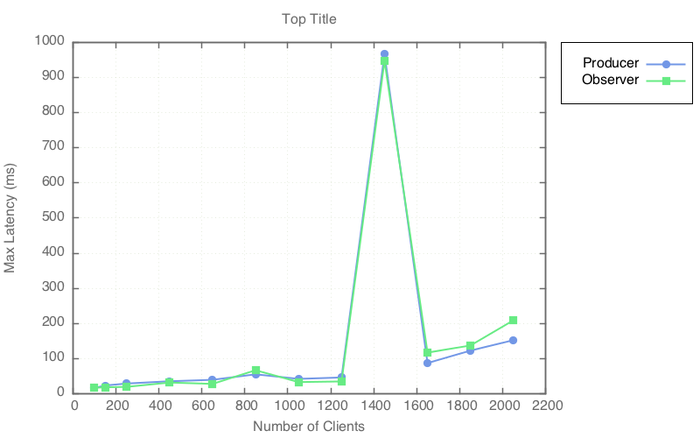
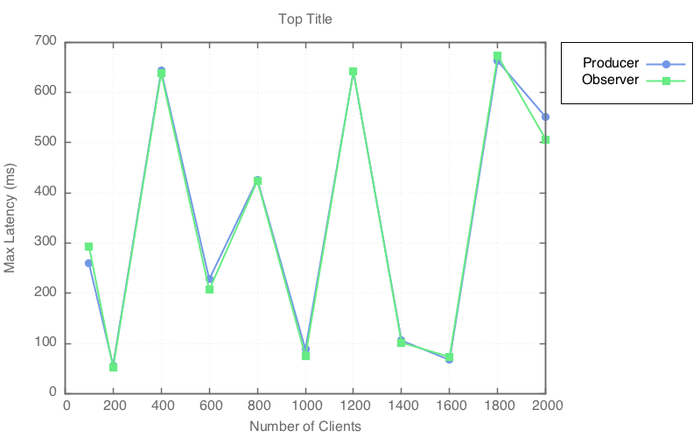
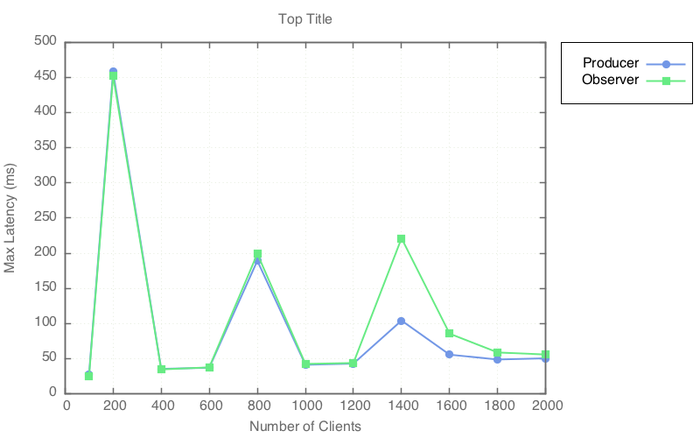
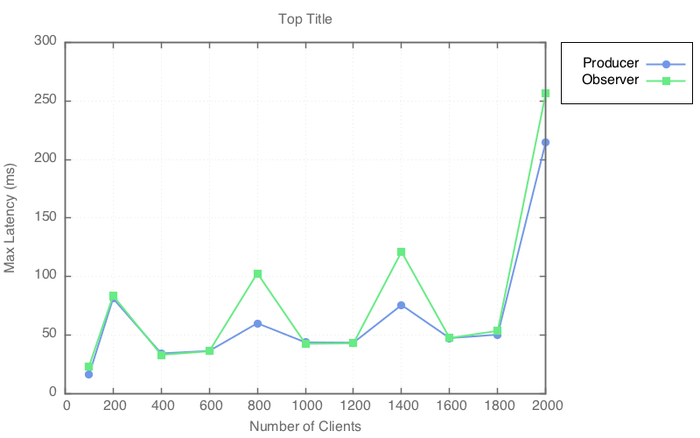
The Y-axis represents the maximum latency (ms) experienced by any client during a given run. Comparing this graph to the 99th percentile gives a rough idea re what sort of outliers were in the population. Note that the spikes may be due to Redis's snapshotting feature (TBD).
C1
C2
C3
Senario 2 (Write-Heavy)
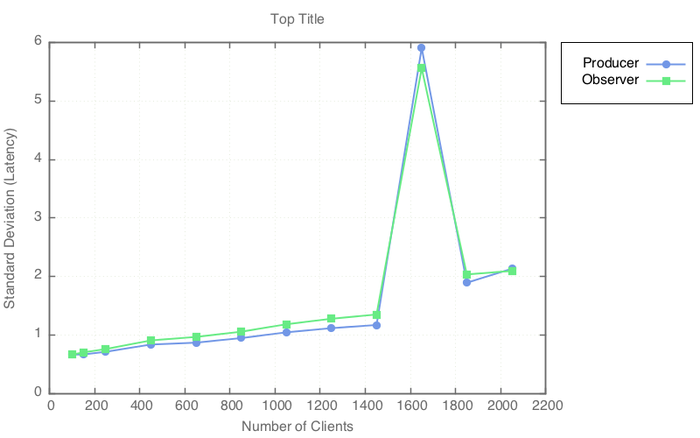
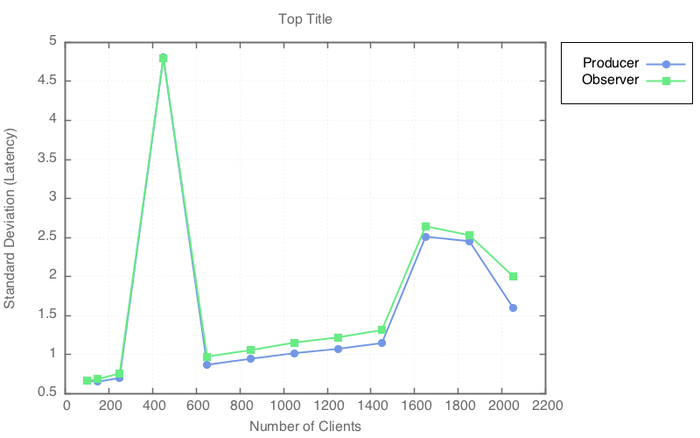
In these tests, observers were held at 50 while the number of producer clients was steadily increased. The X-axis denotes the total number of clients (producers + observers). Each level of load was executed for 5 minutes, after which the samples were used to calculate the following statistics.
Mean Latency
The Y-axis denotes mean latency in milliseconds.
C1
C2
C3
Combined Throughput
The Y-axis denotes the combined throughput (req/sec) for all clients.
C1
C2
C3
Standard Deviation
The Y-axis denotes the standard deviation for per-request latency (ms). Even at small loads there were a few outliers, sitting outside the 99th percentile, that bumped up the stdev. Further experimentation is needed to find the root cause, whether it be in the client, the server, or the Redis instance.
C1
C2
C3
99th Percentile
The Y-axis denotes the per-request latency (ms) for 99% of client requests. In other words, 99% of requests completed within the given time duration.
C1
C2
C3
Maximum Latency
The Y-axis represents the maximum latency (ms) experienced by any client during a given run. Comparing this graph to the 99th percentile gives a rough idea re what sort of outliers were in the population. Note that the spikes may be due to Redis's snapshotting feature (TBD).
C1
C2
C3
Senario 3 (Balanced)
In these tests, both observer and producer clients were increased by the same amount each time. The X-axis denotes the total number of clients (producers + observers).
Mean Latency
The Y-axis denotes mean latency in milliseconds.
C1
C2
C3
Combined Throughput
The Y-axis denotes the combined throughput (req/sec) for all clients.
C1
C2
C3
Standard Deviation
The Y-axis denotes the standard deviation for per-request latency (ms). Even at small loads there were a few outliers, sitting outside the 99th percentile, that bumped up the stdev. Further experimentation is needed to find the root cause, whether it be in the client, the server, or the Redis instance.
C1
C2
C3
99th Percentile
The Y-axis denotes the per-request latency (ms) for 99% of client requests. In other words, 99% of requests completed within the given time duration.
C1
C2
C3
Maximum Latency
The Y-axis represents the maximum latency (ms) experienced by any client during a given run. Comparing this graph to the 99th percentile gives a rough idea of what sort of outliers were in the population. Note that the spikes may be due to Redis's snapshotting feature (TBD).
C1
C2
C3

