Difference between revisions of "Zaqar/Performance/PubSub/Redis"
m (→Configuration 1) |
(→Senario 1) |
||
| Line 16: | Line 16: | ||
* 3x mongo replica set (pooling catalog) | * 3x mongo replica set (pooling catalog) | ||
| − | === Senario 1 === | + | === Senario 1 (Write-Heavy)=== |
| − | In these tests, observers | + | In these tests, observers were held at 50 while the number of producer clients was steadily increased (X axis). Each level of load was executed for 5 minutes, and then the samples were used to calculate the following statistics. |
| + | |||
| + | All requests succeeded, so error rates are not shown. | ||
==== Mean Latency ==== | ==== Mean Latency ==== | ||
| Line 25: | Line 27: | ||
[[File:Zaqar-juno-redis-pubsub-latency-mean-increasing-prod-50-obs.png]] | [[File:Zaqar-juno-redis-pubsub-latency-mean-increasing-prod-50-obs.png]] | ||
| + | |||
| + | ==== Combined Throughput ==== | ||
| + | |||
| + | The Y-axis denotes the combined throughput for all clients in requests/sec. | ||
| + | |||
| + | [[File:Zaqar-juno-redis-pubsub-throughput-increasing-prod-50-obs.png]] | ||
| + | |||
| + | ==== Standard Deviation ==== | ||
| + | |||
| + | The Y-axis denotes the stdev for per-request latency (ms). | ||
| + | |||
| + | [[File:Zaqar-juno-redis-pubsub-stdev-increasing-prod-50-obs.png]] | ||
| + | |||
| + | ==== 99th Percentile ==== | ||
| + | |||
| + | The Y-axis denotes the per-request latency for 99% of client requests. This shows the latency for most of the requests. | ||
| + | |||
| + | [[File:Zaqar-juno-redis-pubsub-99p-increasing-prod-50-obs.png]] | ||
| + | |||
| + | ==== Maximum Latency ==== | ||
| + | |||
| + | The Y-axis represents the maximum latency experienced by any client during a given run. To view the duration for most of the requests, see the 99th percentile graph, above. The spikes are likely due to Redis's snapshotting feature (the default settings were used for redis-server in these tests). | ||
| + | |||
| + | [[File:Zaqar-juno-redis-pubsub-latency-max-increasing-prod-50-obs.png]] | ||
Revision as of 23:06, 15 September 2014
Contents
Overview =
These tests examined the pub-sub performance of the Redis driver (Juno release).
Systems
TODO
Configuration 1
In these tests, various amounts of load was applied to the following configuration:
- 1x4 load balancer
- 1x20 web head (WSGI server)
- 1x1 redis (message store)
- 3x mongo replica set (pooling catalog)
Senario 1 (Write-Heavy)
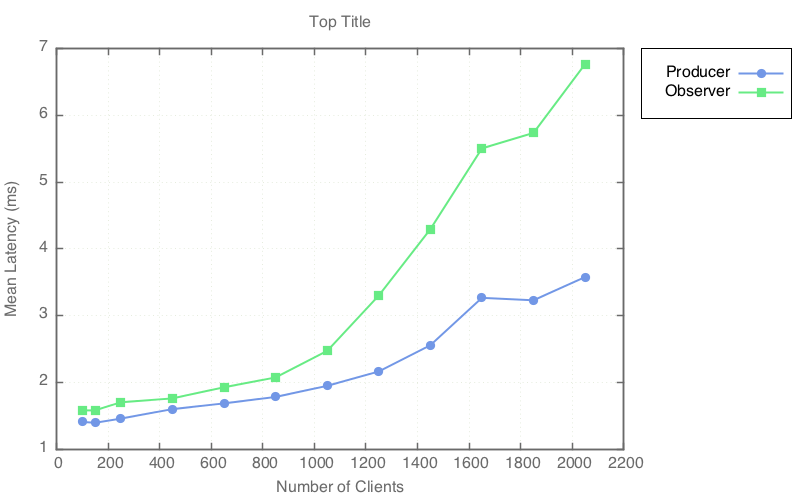
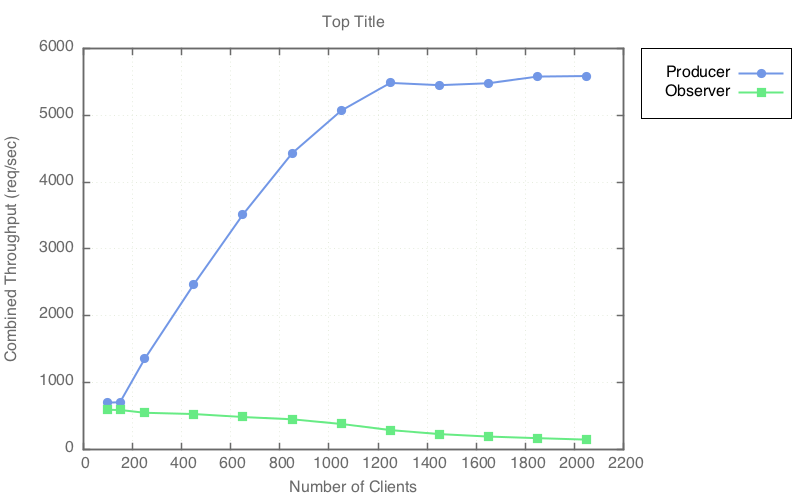
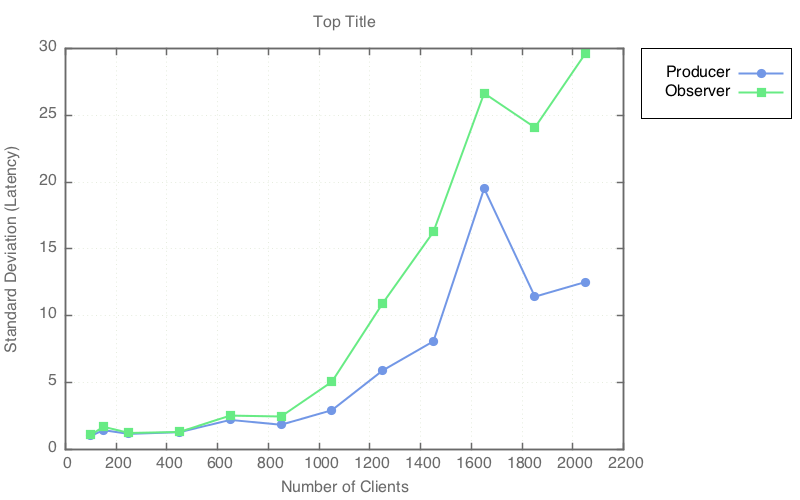
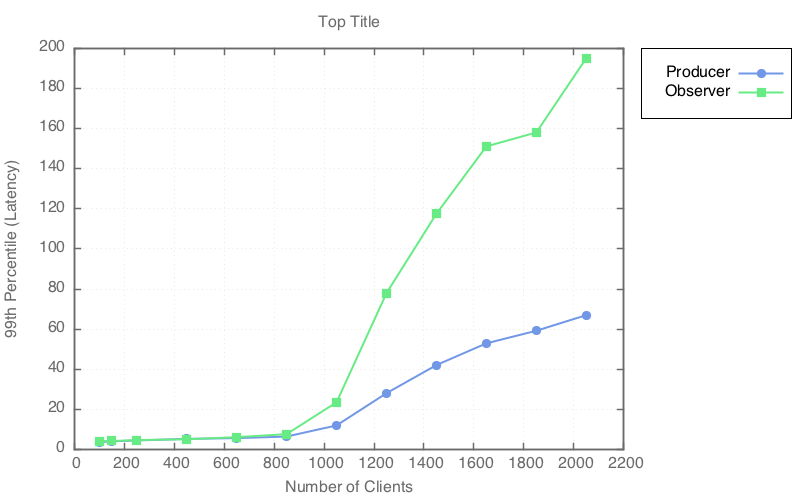
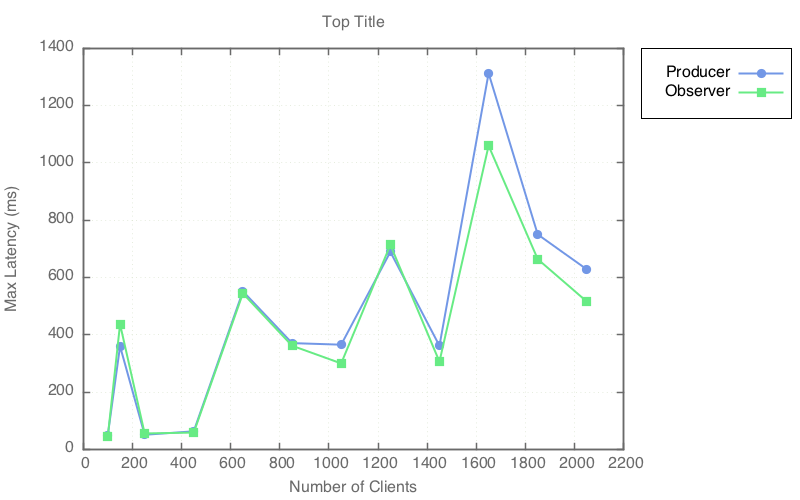
In these tests, observers were held at 50 while the number of producer clients was steadily increased (X axis). Each level of load was executed for 5 minutes, and then the samples were used to calculate the following statistics.
All requests succeeded, so error rates are not shown.
Mean Latency
The Y-axis denotes mean latency in milliseconds.
Combined Throughput
The Y-axis denotes the combined throughput for all clients in requests/sec.
Standard Deviation
The Y-axis denotes the stdev for per-request latency (ms).
99th Percentile
The Y-axis denotes the per-request latency for 99% of client requests. This shows the latency for most of the requests.
Maximum Latency
The Y-axis represents the maximum latency experienced by any client during a given run. To view the duration for most of the requests, see the 99th percentile graph, above. The spikes are likely due to Redis's snapshotting feature (the default settings were used for redis-server in these tests).

