Difference between revisions of "Zabbix-agent-adoption"
m (→Introduction) |
m (→Introduction) |
||
| Line 16: | Line 16: | ||
tool. A snapshot of Zabbix web console is shown in the following figure. | tool. A snapshot of Zabbix web console is shown in the following figure. | ||
| − | [[File:Zabbix items.jpeg|frameless| | + | [[File:Zabbix items.jpeg|frameless|Caption CPU monitoring items in Zabbix]] |
| + | |||
| + | <gallery> | ||
| + | File:Zabbix items.jpeg|Caption1 | ||
| + | </gallery> | ||
However, those guest system metrics, in practice, are highly valuable for both OpenStack Admins and tenants, according to our<br /> | However, those guest system metrics, in practice, are highly valuable for both OpenStack Admins and tenants, according to our<br /> | ||
Revision as of 08:47, 1 November 2013
- Launchpad Entry: CeilometerSpec:Zabbix-agent-adoption
- Created: Oct. 25, 2013
- Contributors: Yu Zhang
Introduction
Currently, Ceilometer collects instance data via compute agents installed on every OpenStack compute nodes. PollingTasks
in a compute agent invoke multiple pollsters, which then call hypervisor-dependent inspectors for metering various metrics.
As an example, the CPUPollster calls the inspect_cpus() method of a hypervisor-dependent inspector object to get VCPU data.
If the hypervisor is KVM, inspect_cpus() calls the info() method of the virDomain class of libvirt, then returns a list of 5 data elements,
including two CPUPollster cares about: VCPU number and running time.
Such pollsters work well for those data easily available to a hypervisor (http://www.mirantis.com/blog/openstack-metering-using-ceilometer/),
while ignoring some detailed and precise guest system metrics which are not provided by a hypervisor. As a simple case study,
we can compare what CPUPollster provides with CPU monitoring items supported by Zabbix, one of the most pupular system monitor
tool. A snapshot of Zabbix web console is shown in the following figure.

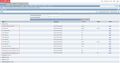
Caption1
However, those guest system metrics, in practice, are highly valuable for both OpenStack Admins and tenants, according to our
own operating experiences and feedback from other companies using OpenStack. Therefore, Zabbix has been deployed in many
product-oriented OpenStack clouds to achieve detailed and precise monitoring. Other popular 3rd-party monitoring tools include
Nagios, Ganglia, etc.
This blueprint aims at leveraging existing monitoring assets and expertises in system administration teams to the best extent, instead
of removing or replacing them with efforts. An adoption mechanism between Zabbix agents in instances and Ceilometer compute agents
in compute nodes will be added, therefore Ceilometer can poll data from Zabbix agents to enhance its capability of monitoring instances.
The feasibility for adopting agents of other 3rd-party monitoring tools, e.g. Nagios and Ganglia, will also be considered in the machanism design.
Design and implementation
To be added