XenServer/Overhead
Xen API driver overhead
Per-VM virtualization overhead calculations were added to the xenapi driver in this review: https://review.openstack.org/#/c/35380/
These values were updated to take into account the number of VCPUs assigned to a VM in this review: https://review.openstack.org/60087
Estimating Overhead
The overhead data below is collected from guest instances in the Rackspace cloud via XenAPI.
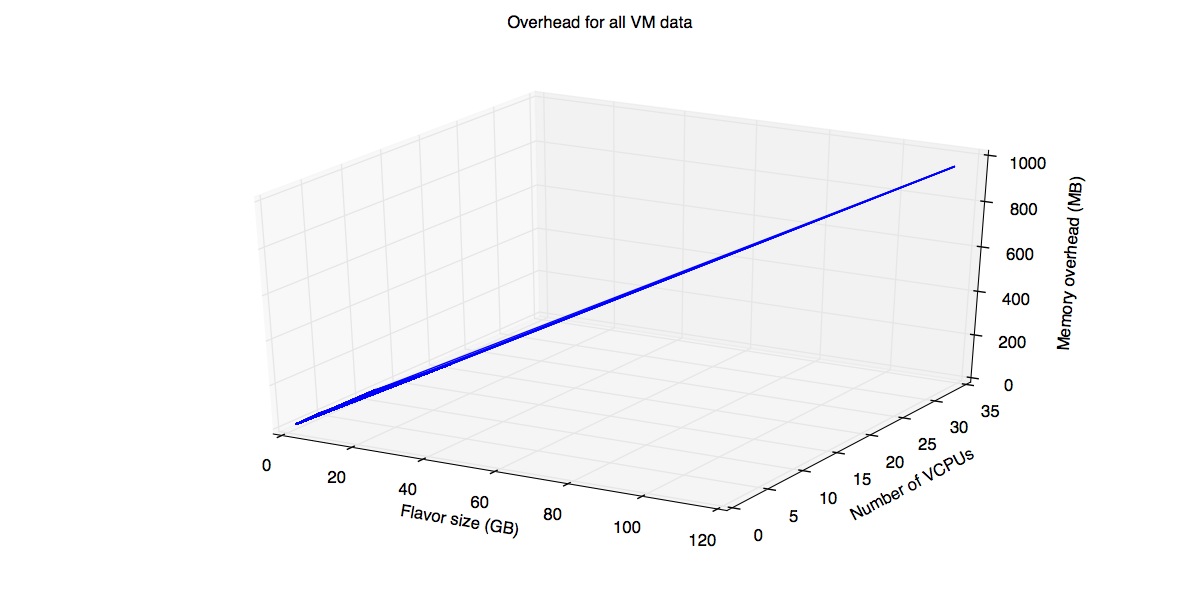
The data was plotted on a graph as follows:
- X-axis: memory size (GB) of the VM
- Y-axis: number of VCPUs allocated to the VM
- Z-axis: memory overhead size (MB) of the VM as observed in XenAPI.
An interpolated equation is fitted over top of the data to predict the overhead based on VM memory size and number of VCPUs.
Data
The formula to calculate overhead is derived from the following data:
| VM memory size (GB) | VM number of VCPUs | VM memory overhead | Overhead/MB | Predicted Overhead |
|---|---|---|---|---|
| 256.0 | 1 | 4.0 | 0.015625 | 6.49936 |
| 512.0 | 1 | 7.0 | 0.013671875 | 8.49872 |
| 1024.0 | 1 | 10.0 | 0.009765625 | 12.49744 |
| 1024.0 | 1 | 11.0 | 0.0107421875 | 12.49744 |
| 512.0 | 1 | 6.0 | 0.01171875 | 8.49872 |
| 2048.0 | 1 | 19.0 | 0.00927734375 | 20.49488 |
| 3972.02233887 | 2 | 35.0 | 0.00881163221503 | 37.0214944666 |
| 3895.72839355 | 2 | 34.0 | 0.00872750781503 | 36.4256387537 |
| 1508.39562988 | 2 | 15.0 | 0.00994434066424 | 17.7805698694 |
| 4086.0 | 2 | 36.0 | 0.00881057268722 | 37.91166 |
| 2048.0 | 2 | 19.0 | 0.00927734375 | 21.99488 |
| 4048.31628418 | 2 | 35.0 | 0.00864556955117 | 37.6173501794 |
| 2048.0 | 2 | 20.0 | 0.009765625 | 21.99488 |
| 4057.85302734 | 2 | 36.0 | 0.0088716865193 | 37.6918321436 |
| 4073.77954102 | 2 | 35.0 | 0.0085915302111 | 37.8162182153 |
| 4096.0 | 2 | 35.0 | 0.008544921875 | 37.98976 |
| 4096.0 | 2 | 36.0 | 0.0087890625 | 37.98976 |
| 4072.0 | 2 | 35.0 | 0.0085952848723 | 37.80232 |
| 4096.0 | 4 | 38.0 | 0.00927734375 | 40.98976 |
| 4096.0 | 4 | 37.0 | 0.009033203125 | 40.98976 |
| 15360.0 | 4 | 125.0 | 0.00813802083333 | 128.9616 |
| 512.0 | 4 | 9.0 | 0.017578125 | 12.99872 |
| 8192.0 | 4 | 70.0 | 0.008544921875 | 72.97952 |
| 8192.0 | 4 | 69.0 | 0.0084228515625 | 72.97952 |
| 1024.0 | 4 | 14.0 | 0.013671875 | 16.99744 |
| 1024.0 | 4 | 13.0 | 0.0126953125 | 16.99744 |
| 2048.0 | 4 | 21.0 | 0.01025390625 | 24.99488 |
| 256.0 | 4 | 7.0 | 0.02734375 | 10.99936 |
| 15360.0 | 4 | 126.0 | 0.008203125 | 128.9616 |
| 15258.7890625 | 6 | 127.0 | 0.008323072 | 131.171142578 |
| 15324.7539062 | 6 | 127.0 | 0.00828724564041 | 131.686328008 |
| 15169.2651367 | 6 | 126.0 | 0.00830626921373 | 130.471960718 |
| 15264.6325684 | 6 | 127.0 | 0.00831988581653 | 131.216780359 |
| 15267.1328125 | 6 | 127.0 | 0.00831852329836 | 131.236307266 |
| 15360.0 | 6 | 127.0 | 0.00826822916667 | 131.9616 |
| 15335.0830078 | 6 | 128.0 | 0.00834687363184 | 131.766998291 |
| 15360.0 | 6 | 128.0 | 0.00833333333333 | 131.9616 |
| 14819.2524414 | 6 | 124.0 | 0.00836749360268 | 127.738361567 |
| 15256.3276367 | 6 | 128.0 | 0.00838996140145 | 131.151918843 |
| 30720.0 | 8 | 249.0 | 0.00810546875 | 254.9232 |
| 8192.0 | 8 | 74.0 | 0.009033203125 | 78.97952 |
| 8192.0 | 8 | 73.0 | 0.0089111328125 | 78.97952 |
| 30720.0 | 8 | 250.0 | 0.00813802083333 | 254.9232 |
| 61440.0 | 16 | 497.0 | 0.00808919270833 | 506.8464 |
| 61440.0 | 16 | 498.0 | 0.00810546875 | 506.8464 |
| 92160.0 | 24 | 745.0 | 0.00808376736111 | 758.7696 |
| 92160.0 | 24 | 746.0 | 0.00809461805556 | 758.7696 |
| 122880.0 | 32 | 994.0 | 0.00808919270833 | 1010.6928 |
| 122880.0 | 32 | 993.0 | 0.0080810546875 | 1010.6928 |
Graph
The following graph was produced via matplotlib:
Equation
The following equation is an interpolation of the above data done via the Affine method in Mac OS X's Grapher app:
overhead = (a * flavor_mb) + (b * num_vcpus) + c
a and b are the constants: a = 0.0078 b = 0.9674 c = 1.6162

