Vitrage
Contents
What is Vitrage?
Vitrage is the Openstack RCA (Root Cause Analysis) Engine for organizing, analyzing and expanding OpenStack alarms & events, yielding insights regarding the root cause of problems and deducing the existence of problems before they are directly detected.
Mission & Scope
Vitrage is a project dedicated to making the events and alarms in OpenStack more meaningful and helpful. The ideal to which we strive is that every significant event in the system should have a timely alarm/event generated for it, that alarms are raised as early as possible after the event, and that the cause-effect relationships between different events is understood and visualized.
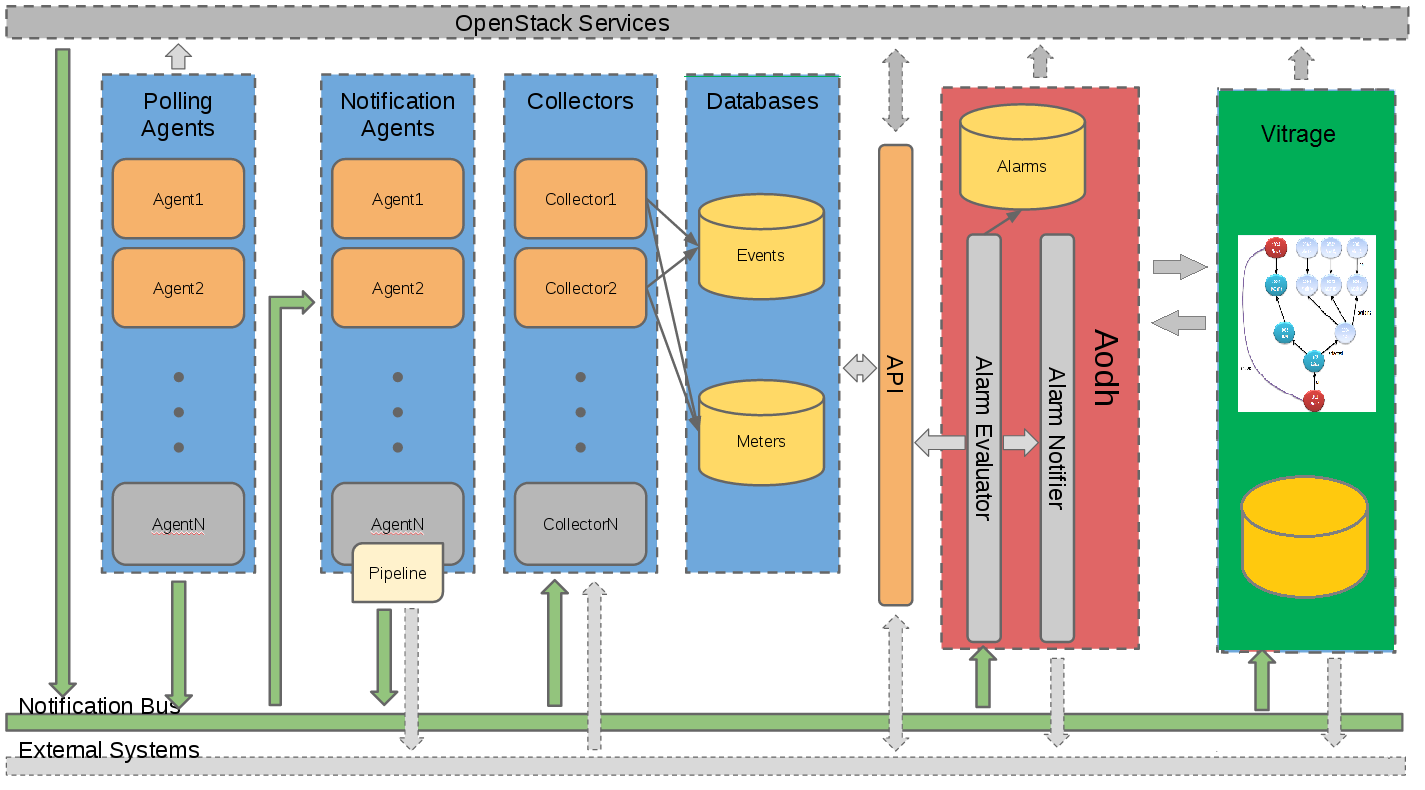
The Vitrage project is intended to be a part of Ceilometer project. It will get events and alarms from Aodh and from other OpenStack components. Whenever a new alarm is raised, it will process it and may produce RCA information, create alarm aggregation or raise new Alarms in Aodh.
High Level Functionality
- Root Cause Analysis (RCA) for alarms/events
- Deduced alarms and states (i.e., raising an alarm or modifying a state based on analysis of system, not only direct monitoring)
- Alarm Aggregation (i.e., grouping alarms by categories, such as resources and severity, making them more manageable and understandable)
- Physical-to-Virtual entities mapping
- UI support for all features above
Use Cases
Baseline
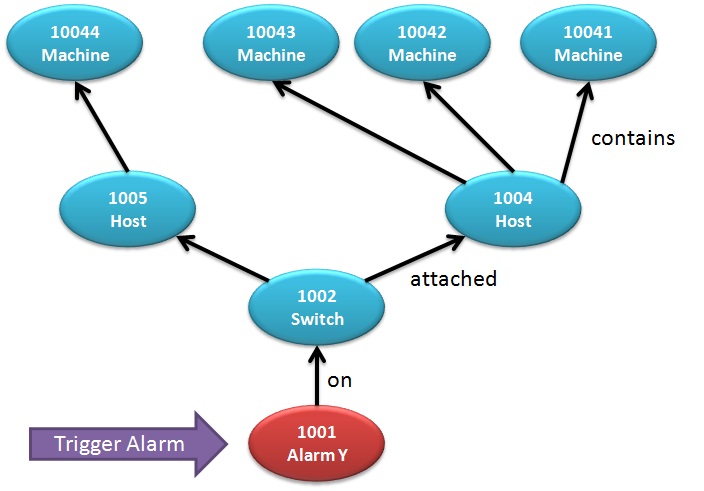
We consider the following example, where a we are monitoring a Switch (id 1002), for example via Nagios test, and as a result an alarm is raised on a Switch. The following image depicts the logical relationship among different resources in the system that are related to this switch. Note the mapping between virtual (machine) and physical (host, switch) entities.
Deduced alarms & states
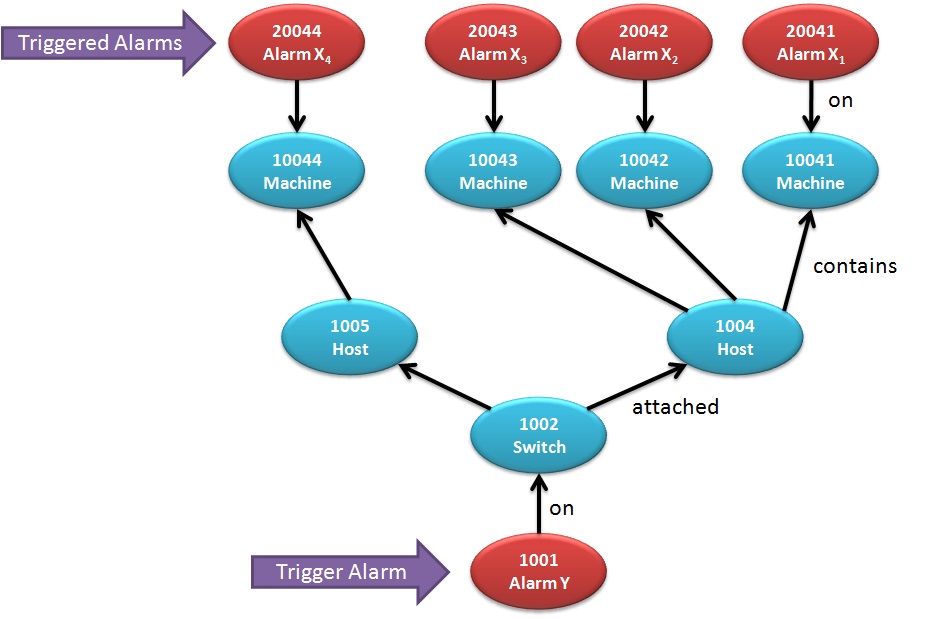
The problems on the switch can, at times, have a bad impact on the VMs running on hosts attached to the switch, and we would like to have an alarm on those VMs to indicate this, as shown here:
As can be seen, an alarm is raised on all VMs associated with the switch. Similarly, we could want the state of all VMs to be changed to "ERROR". We would like to be able to do this even if, perhaps due to the problem with the switch, we cannot directly monitor the state of the VMs, since we can deduce this problem from the state of the switch.
Root Cause Indicators
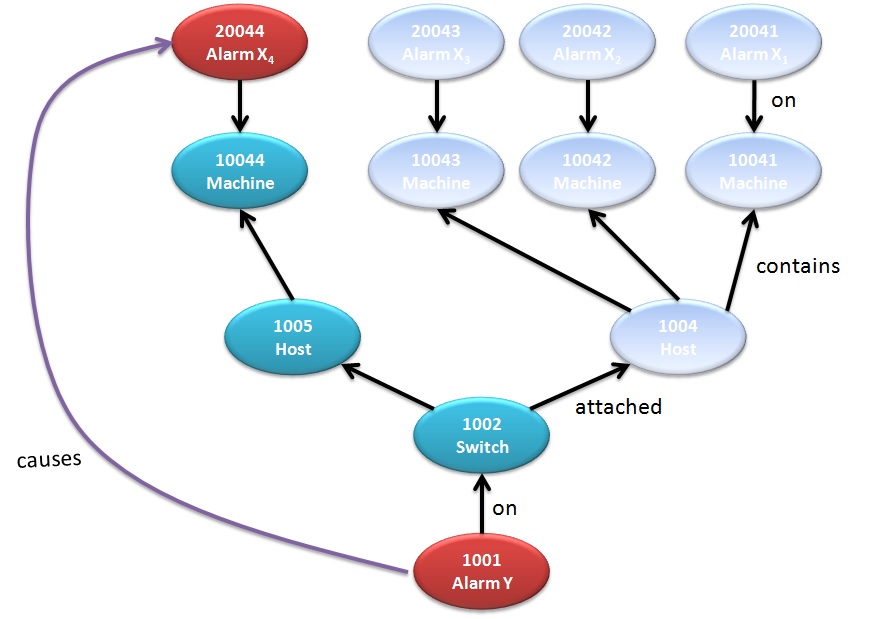
Furthermore, we would like to be able to track this cause and effect - that the problem in the switch caused a problem in the VMs. In the following image, we highlight a single connection between the cause and effect for clarity - but all such links will be supported.
Important Note: not all deduced alarms are caused by the trigger - the trigger might only be an indication of correlation, not causation. In the case we are examining, however, the trigger is also the cause:
Once the local "causes" links (one hop) are detected and registered, we can follow them one hop after another to track the full causal chain of a sequence of events.
Development (Blueprints, Roadmap, Design...)
- Blueprints
- Source Code
- Project at Launchpad: http://launchpad.net/vitrage
- IRC channel for regular daily discussions: #openstack-vitrage
- Vitrage Team


