Vitrage
Contents
What is Vitrage?
Vitrage is the Openstack RCA (Root Cause Analysis) Engine for organizing, analyzing and expanding OpenStack alarms & events, yielding insights regarding the root cause of problems and deducing the existence of problems before they are directly detected.
High Level Functionality
- Physical-to-Virtual entities mapping
- Deduced alarms and states (i.e., raising an alarm or modifying a state based on analysis of system, not only direct monitoring)
- Root Cause Analysis (RCA) for alarms/events
- Horizon plugin for all features above
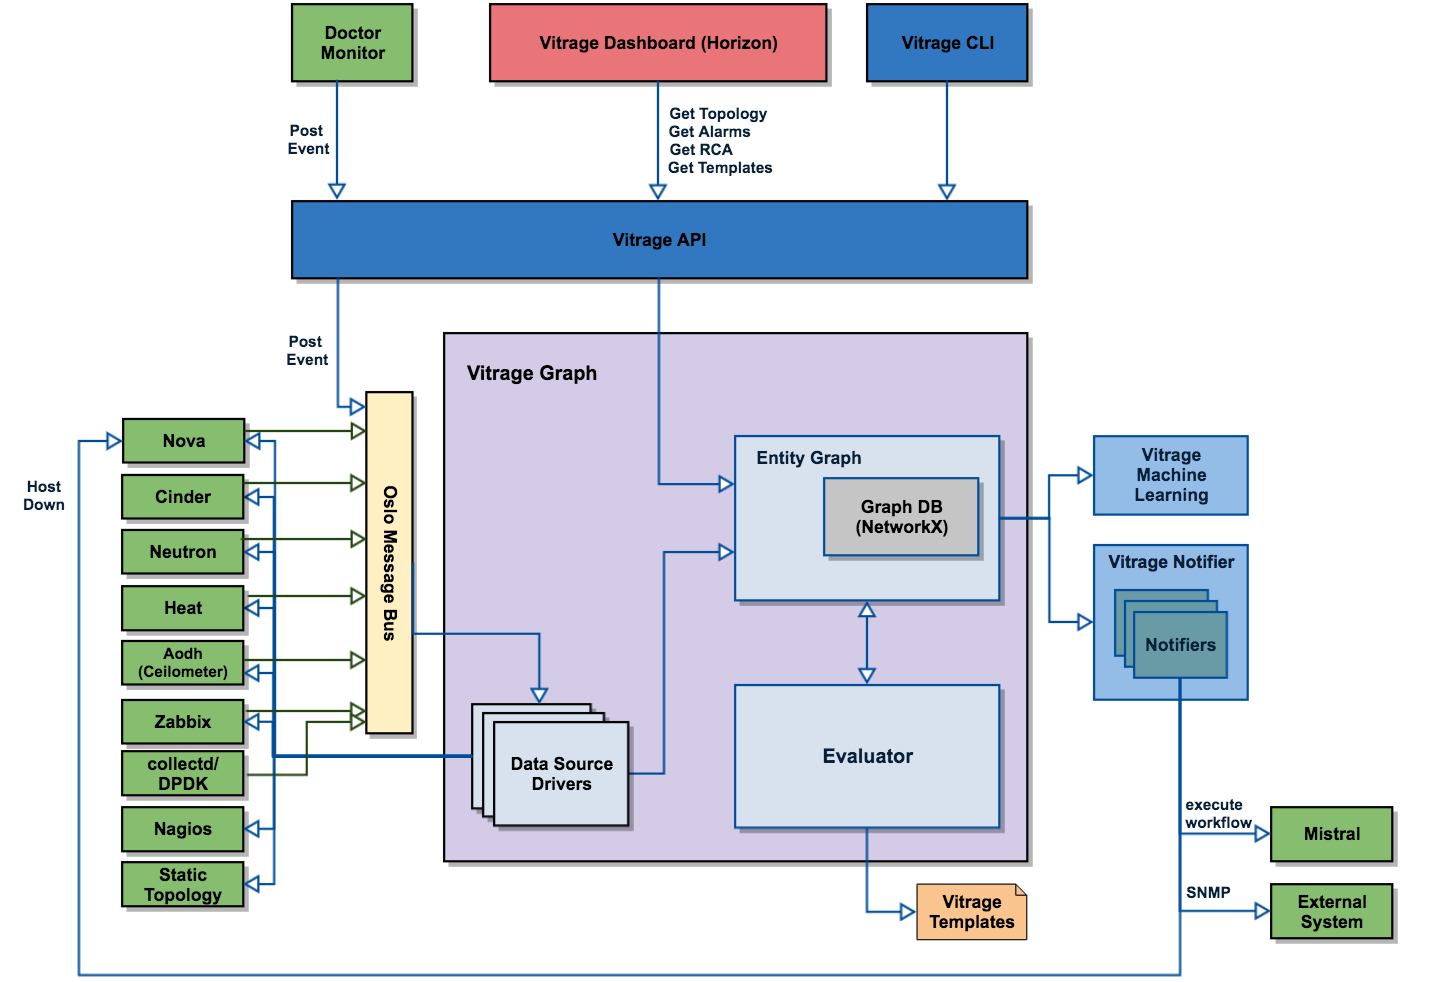
High Level Architecture
Vitrage Synchronizer(s) is responsible for importing information from different components - physical, virtual, alarms, etc., and passing it to Vitrage Graph. In Mitaka we will support Nova, Nagios, Aodh and Static Physical Resources plugins.
Vitrage Graph holds the different entities in the Cloud and their inter-relations. It contains the graph DB itself and a collection of basic graph algorithms (e.g., sub-matching algorithms , BFS, DFS and etc).
Vitrage Evaluator Coordinates the analysis of the Vitrage Graph and processes the results of this analysis. It is responsible for execution different kind of actions on the vitrage graph, such as add RCA (Root Cause Analysis) relationship and Raise Deduced Alarms.
For more information, refer to the low level design
Use Cases
Baseline
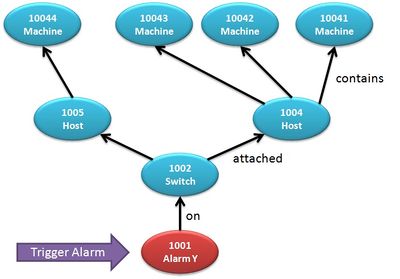
We consider the following example, where a we are monitoring a Switch (id 1002), for example via Nagios test, and as a result an alarm is raised on a Switch. The following image depicts the logical relationship among different resources in the system that are related to this switch. Note the mapping between virtual (machine) and physical (host, switch) entities.
Deduced alarms & states
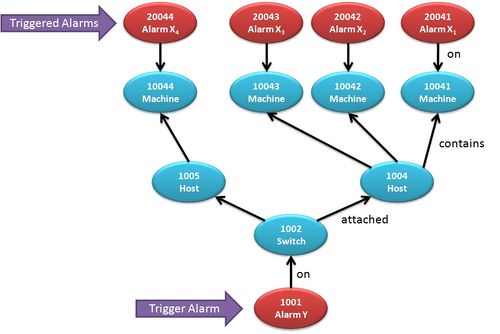
The problems on the switch can, at times, have a bad impact on the VMs running on hosts attached to the switch, and we would like to have an alarm on those VMs to indicate this, as shown here:
As can be seen, an alarm is raised on all VMs associated with the switch. Similarly, we could want the state of all VMs to be changed to "ERROR". We would like to be able to do this even if, perhaps due to the problem with the switch, we cannot directly monitor the state of the VMs, since we can deduce this problem from the state of the switch.
Root Cause Indicators
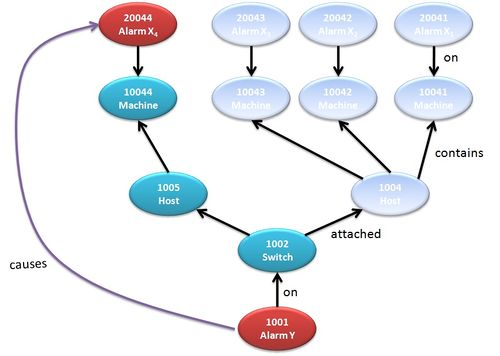
Furthermore, we would like to be able to track this cause and effect - that the problem in the switch caused a problem in the VMs. In the following image, we highlight a single connection between the cause and effect for clarity - but all such links will be supported.
Important Note: not all deduced alarms are caused by the trigger - the trigger might only be an indication of correlation, not causation. In the case we are examining, however, the trigger is also the cause:
Once the local "causes" links (one hop) are detected and registered, we can follow them one hop after another to track the full causal chain of a sequence of events.
Development (Blueprints, Roadmap, Design...)
Design and Implementation
- Project at Launchpad: http://launchpad.net/vitrage
- Blueprints
- Source Code
- Design
Demos and Presentations
- First use case - Get Topology
Communication and Meetings
Meetings
- Weekly on Wednesday at 0900 UTC in #openstack-meeting-3 at freenode
- Check Vitrage Meetings for more details
Contact Us
- IRC channel for regular daily discussions: #openstack-vitrage
- Use [Vitrage] tag for Vitrage emails on OpenStack Mailing Lists
- Contact Persons
- Alexey Weyl - alexey.weyl@nokia.com
- Ifat Afek - PTL - ifat.afek@nokia.com
- Elisha Rosensweig - elisha.rosensweig@nokia.com
- Ohad Shamir - ohad.shamir@nokia.com


