Difference between revisions of "Vitrage"
(→High Level Architecture) |
(→High Level Architecture) |
||
| (100 intermediate revisions by 5 users not shown) | |||
| Line 1: | Line 1: | ||
| − | + | __NOTOC__ | |
| − | |||
| − | |||
| + | [[File:OpenStack_Project_Vitrage_horizontal.png|450px|thumbnail|right]] | ||
== What is Vitrage? == | == What is Vitrage? == | ||
| − | Vitrage is the | + | Vitrage is the OpenStack RCA (Root Cause Analysis) service for organizing, analyzing and expanding OpenStack alarms & events, yielding insights regarding the root cause of problems and deducing their existence before they are directly detected. |
| + | |||
| + | === High Level Functionality === | ||
| + | # Physical-to-Virtual entities mapping | ||
| + | # Deduced alarms and states (i.e., raising an alarm or modifying a state based on analysis of the system, instead of direct monitoring) | ||
| + | # Root Cause Analysis (RCA) for alarms/events | ||
| + | # Horizon plugin for the above features | ||
| + | |||
| + | |||
| + | |||
| + | |||
| + | |||
| + | |||
| + | |||
| + | == High Level Architecture == | ||
| + | |||
| + | [[File:Vitrage_architecture_train.png|2000px|frameless|center|Vitrage High Level Architecture]] <br /> | ||
| − | |||
| − | |||
| − | + | '''Vitrage Data Source(s).''' Responsible for importing information from different sources, regarding the state of the system. This includes information regarding resources both physical & virtual, alarms, etc.. The information is then processed into the Vitrage Graph. Currently Vitrage comes ready with data sources for Nova, Cinder, and Aodh OpenStack projects, Nagios alarms, and a static Physical Resources data source. | |
| − | + | '''Vitrage Graph.''' Holds the information collected by the Data Sources, as well as their inter-relations. Additionally, it implements a collection of basic graph algorithms that are used by the Vitrage Evaluator (e.g., sub-matching, BFS, DFS etc). | |
| − | + | '''Vitrage Evaluator.''' Coordinates the analysis of (changes to) the Vitrage Graph and processes the results of this analysis. It is responsible for execution different kind of template-based actions in Vitrage, such as to add an RCA (Root Cause Analysis) relationship between alarms, raise a deduced alarm or set a deduced state. | |
| − | + | ||
| − | + | For more information, refer to the [https://docs.openstack.org/vitrage/latest/contributor/vitrage-graph-design.html low level design] | |
| − | |||
| − | |||
| − | |||
== Use Cases == | == Use Cases == | ||
=== Baseline === | === Baseline === | ||
| − | We consider the following example, where a we are monitoring a Switch (id 1002), for example via Nagios | + | [[File:Rca-baseline.jpg|400px|frameless|right|Baseline]] <br /> |
| + | |||
| + | We consider the following example, where a we are monitoring a Switch (id 1002), for example via Nagios, and as a problem on the Switch causes a Nagios alarm (a.k.a. Nagios test) to be activated. The following image depicts the logical relationship among different resources in the system that are related to this switch, as well as the raised alarm. Note the mapping between virtual (instance) and physical (host, switch) entities, as well as between the alarm and the switch it relates to. | ||
| + | |||
| + | |||
| + | |||
| + | |||
| + | |||
| + | |||
| + | |||
| + | |||
| + | |||
| + | |||
| + | |||
| + | |||
| + | |||
| − | |||
=== Deduced alarms & states === | === Deduced alarms & states === | ||
| − | + | [[File:DeducedAlarm.jpg|500px|frameless|right|Deduced Alarm]] <br /> | |
| + | |||
| + | Problems on the switch can, at times, have a negative impact on the virtual instances running on hosts attached to the switch. We would like to raise an alarm on those instances to indicate this impact, as shown here: | ||
| + | |||
| + | As can be seen, the problem on the switch should trigger an alarm on all instances associated with the switch. Similarly, we might want the state of all these instances to be changed to "ERROR" as well. This functionality should be supported even if we cannot directly monitor the state of the instances. Instances might not be monitored for all aspects of performance, or perhaps the problem in the switch makes monitoring them difficult or even impossible. Instead, we can '''deduce''' this problem exists on the instances based on the state of the switch, and raise alarms and change states accordingly. | ||
| − | |||
| − | |||
| − | |||
| − | |||
| − | |||
| − | |||
| − | |||
| − | |||
| − | |||
| − | |||
| − | |||
| − | |||
| − | |||
| − | |||
| − | + | === Root Cause Indicators === | |
| − | + | [[File:RootCauseExample.jpg|500px|frameless|right|Root Cause Link]] <br /> | |
| + | Furthermore, we would like to be able to track this cause and effect - that the problem in the switch caused the problems experienced at the instances. In the following image, we highlight a single connection between the cause and effect for clarity - but all such links should be supported. | ||
| − | '' | + | Important Note: not all deduced alarms are ''caused'' by the trigger - the trigger might only be an indication of correlation, not causation. In the case we are examining, however, the trigger alarm is also the cause: |
| − | + | Once the local "causes" links (one hop) are detected and registered, we can follow them one hop after another to track the full causal chain of a sequence of events. | |
| − | |||
| − | |||
| − | |||
| − | |||
| − | |||
| − | |||
| − | |||
| − | |||
| − | |||
| − | |||
| − | + | == Demos and Presentations == | |
| + | === Quick Demos (A bit outdated) === | ||
| + | * [https://www.youtube.com/watch?v=tl5AD5IdzMo&feature=youtu.be Vitrage Functionalities Overview] | ||
| + | * [https://www.youtube.com/watch?v=GyTnMw8stXQ&feature=youtu.be Vitrage Get Topology Demo] | ||
| + | * [https://www.youtube.com/watch?v=w1XQATkrdmg Vitrage Alarms Demo] | ||
| + | * [https://www.youtube.com/watch?v=vqlOKTmYR4c Vitrage Deduced Alarms and RCA Demo] | ||
| + | |||
| + | === Summit Sessions === | ||
| + | ==== OpenStack Austin, April 2016 ==== | ||
| + | * [https://www.youtube.com/watch?v=9Qw5coTLgMo Project Vitrage How to Organize, Analyze and Visualize your OpenStack Cloud] | ||
| + | * [https://www.youtube.com/watch?v=ey68KNKXc5c On the Path to Telco Cloud Openness: Nokia CloudBand Vitrage & OPNFV Doctor collaboration] | ||
| + | ==== OPNFV Berlin, June 2016 ==== | ||
| + | * [https://www.youtube.com/watch?v=qV4eLhsFR28 Failure Inspection in Doctor utilizing Vitrage and Congress] | ||
| + | * [https://www.youtube.com/watch?v=xutITYoZKhE Doctor: fast and dynamic fault management in OpenStack (DOCOMO, NTT, NEC, Nokia, Intel) - Telecom TV] | ||
| + | ==== OpenStack Barcelona, October 2016 ==== | ||
| + | * [https://www.openstack.org/videos/video/demo-openstack-and-opnfv-keeping-your-mobile-phone-calls-connected OpenStack Keynotes demo with Doctor - Keeping Your Mobile Phone Calls Connected] | ||
| + | * [https://www.openstack.org/videos/video/nokia-root-cause-analysis-principles-and-practice-in-openstack-and-beyond Root Cause Analysis Principles and Practice in OpenStack and Beyond] | ||
| + | * [https://www.openstack.org/videos/video/fault-management-with-openstack-congress-and-vitrage-based-on-opnfv-doctor-framework Fault Management with OpenStack Congress and Vitrage Based on OPNFV Doctor Framework] | ||
| + | ==== OpenStack Boston, May 2017 ==== | ||
| + | * [https://www.openstack.org/videos/boston-2017/beyond-automation-taking-vitrage-into-the-realm-of-machine-learning Beyond Automation - Taking Vitrage Into the Realm of Machine Learning] | ||
| + | * [https://www.openstack.org/videos/boston-2017/collectd-and-vitrage-integration-an-eventful-presentation Collectd and Vitrage Integration - An Eventful Presentation] | ||
| + | * [https://www.openstack.org/videos/boston-2017/the-vitrage-story-from-nothing-to-the-big-tent The Vitrage Story - From Nothing to the Big Tent] | ||
| + | * [https://www.openstack.org/videos/boston-2017/advanced-use-cases-for-root-cause-analysis Advanced Use Cases for Root Cause Analysis] | ||
| + | * [https://www.openstack.org/videos/boston-2017/project-update-vitrage Project Update Vitrage] | ||
| + | ==== OpenStack Sydney, November 2017 ==== | ||
| + | * [https://www.openstack.org/videos/sydney-2017/advanced-fault-management-with-vitrage-and-mistral Advanced Fault Management with Vitrage and Mistral] | ||
| + | * [https://www.openstack.org/videos/sydney-2017/vitrage-project-updates Vitrage Project Updates] | ||
| + | ==== OpenStack Vancouver, May 2018 ==== | ||
| + | * [https://www.openstack.org/videos/vancouver-2018/closing-the-loop-vnf-end-to-end-failure-detection-and-auto-healing Closing the Loop: VNF end-to-end Failure Detection and Auto Healing] | ||
| + | * [https://www.openstack.org/videos/vancouver-2018/extend-horizon-headers-for-easy-monitoring-and-fault-detection-and-more Extend Horizon Headers for easy monitoring and fault detection - and more] | ||
| + | * [https://www.openstack.org/videos/vancouver-2018/vitrage-project-update Vitrage - Project Update] | ||
| + | * [https://www.openstack.org/videos/vancouver-2018/proactive-root-cause-analysis-with-vitrage-kubernetes-zabbix-and-prometheus Proactive Root Cause Analysis with Vitrage, Kubernetes, Zabbix and Prometheus] | ||
| − | |||
== Development (Blueprints, Roadmap, Design...) == | == Development (Blueprints, Roadmap, Design...) == | ||
| − | * [https:// | + | * [https://docs.openstack.org/vitrage/latest Vitrage Documentation] |
| − | * [https://github.com/openstack/vitrage | + | * Vitrage in StoryBoard: |
| − | * | + | ** [https://storyboard.openstack.org/#!/board/90 Main board] |
| − | * | + | ** [https://storyboard.openstack.org/#!/board/89 Bugs] |
| − | * [https:// | + | ** [https://etherpad.openstack.org/p/vitrage-storyboard-migration StoryBoard how-to] |
| + | * [https://wiki.openstack.org/wiki/Vitrage/RoadMap Road Map] | ||
| + | * Source code: | ||
| + | ** [https://github.com/openstack/vitrage vitrage] | ||
| + | ** [https://github.com/openstack/python-vitrageclient python-vitrageclient] | ||
| + | ** [https://github.com/openstack/vitrage-dashboard vitrage-dashboard] | ||
| + | ** [https://github.com/openstack/vitrage-tempest-plugin vitrage-tempest-plugin] | ||
| + | |||
| + | === Design Discussions === | ||
| + | * [https://etherpad.openstack.org/p/vitrage-overlapping-templates-support-design Supporting Overlapping Templates] | ||
| + | * [https://etherpad.openstack.org/p/vitrage-barcelona-design-summit Barcelona Design Summit] | ||
| + | * [https://etherpad.openstack.org/p/vitrage-pike-design-sessions Pike PTG] | ||
| + | * [https://etherpad.openstack.org/p/vitrage-ptg-queens Queens PTG] | ||
| + | * [https://etherpad.openstack.org/p/YVR-vitrage-advanced-use-cases Vancouver forum: Vitrage advanced use cases] | ||
| + | * [https://etherpad.openstack.org/p/YVR-vitrage-rca-over-k8s Vancouver forum: Vitrage RCA over Kubernetes] | ||
| + | |||
| − | == | + | == Communication and Meetings == |
| + | === Meetings === | ||
| + | * Weekly on Wednesday at 0800 UTC in #openstack-meeting-4 at freenode | ||
| + | * Check [https://wiki.openstack.org/wiki/Meetings/Vitrage Vitrage Meetings] for more details | ||
| − | + | === Contact Us === | |
| + | * IRC channel for regular daily discussions: #openstack-vitrage | ||
| + | * Use [Vitrage] tag for Vitrage emails on [http://lists.openstack.org/pipermail/openstack-discuss/ OpenStack Mailing List] | ||
Latest revision as of 11:08, 23 May 2019
What is Vitrage?
Vitrage is the OpenStack RCA (Root Cause Analysis) service for organizing, analyzing and expanding OpenStack alarms & events, yielding insights regarding the root cause of problems and deducing their existence before they are directly detected.
High Level Functionality
- Physical-to-Virtual entities mapping
- Deduced alarms and states (i.e., raising an alarm or modifying a state based on analysis of the system, instead of direct monitoring)
- Root Cause Analysis (RCA) for alarms/events
- Horizon plugin for the above features
High Level Architecture
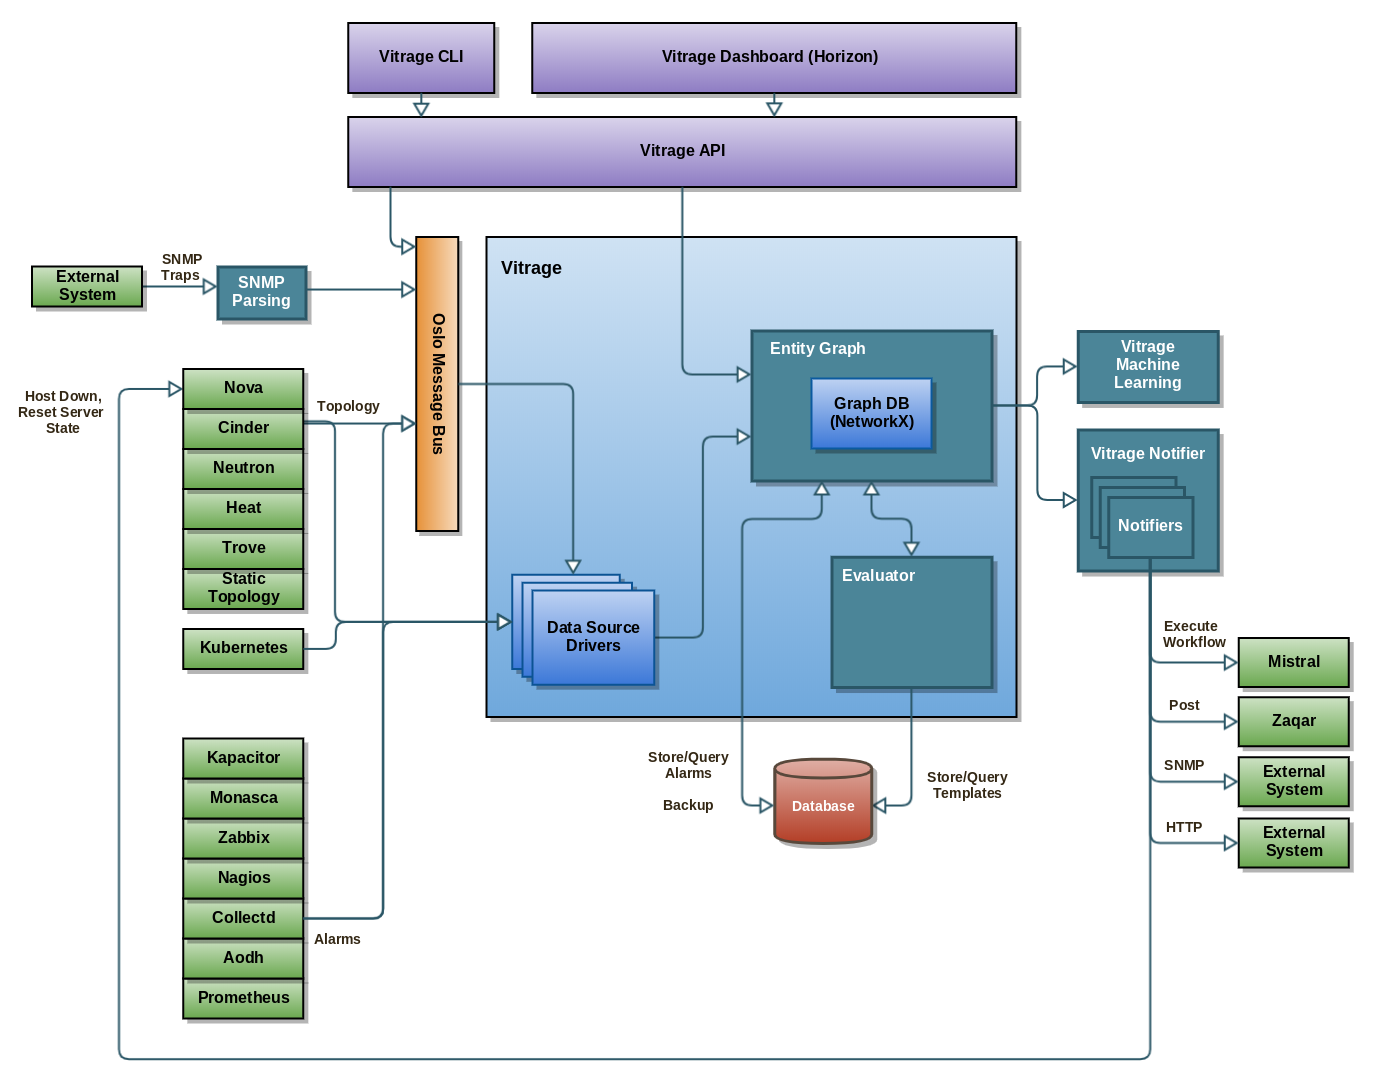
Vitrage Data Source(s). Responsible for importing information from different sources, regarding the state of the system. This includes information regarding resources both physical & virtual, alarms, etc.. The information is then processed into the Vitrage Graph. Currently Vitrage comes ready with data sources for Nova, Cinder, and Aodh OpenStack projects, Nagios alarms, and a static Physical Resources data source.
Vitrage Graph. Holds the information collected by the Data Sources, as well as their inter-relations. Additionally, it implements a collection of basic graph algorithms that are used by the Vitrage Evaluator (e.g., sub-matching, BFS, DFS etc).
Vitrage Evaluator. Coordinates the analysis of (changes to) the Vitrage Graph and processes the results of this analysis. It is responsible for execution different kind of template-based actions in Vitrage, such as to add an RCA (Root Cause Analysis) relationship between alarms, raise a deduced alarm or set a deduced state.
For more information, refer to the low level design
Use Cases
Baseline
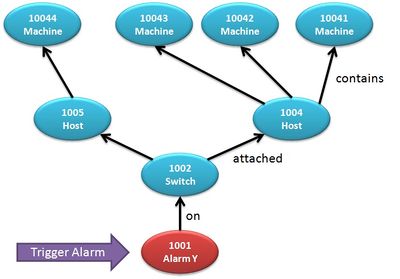
We consider the following example, where a we are monitoring a Switch (id 1002), for example via Nagios, and as a problem on the Switch causes a Nagios alarm (a.k.a. Nagios test) to be activated. The following image depicts the logical relationship among different resources in the system that are related to this switch, as well as the raised alarm. Note the mapping between virtual (instance) and physical (host, switch) entities, as well as between the alarm and the switch it relates to.
Deduced alarms & states
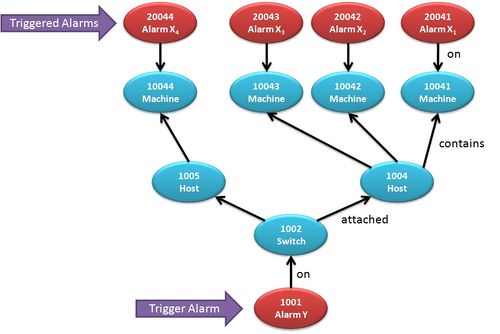
Problems on the switch can, at times, have a negative impact on the virtual instances running on hosts attached to the switch. We would like to raise an alarm on those instances to indicate this impact, as shown here:
As can be seen, the problem on the switch should trigger an alarm on all instances associated with the switch. Similarly, we might want the state of all these instances to be changed to "ERROR" as well. This functionality should be supported even if we cannot directly monitor the state of the instances. Instances might not be monitored for all aspects of performance, or perhaps the problem in the switch makes monitoring them difficult or even impossible. Instead, we can deduce this problem exists on the instances based on the state of the switch, and raise alarms and change states accordingly.
Root Cause Indicators
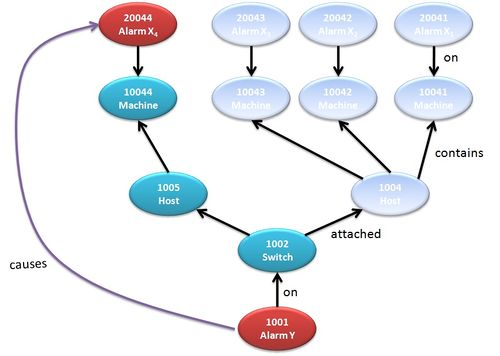
Furthermore, we would like to be able to track this cause and effect - that the problem in the switch caused the problems experienced at the instances. In the following image, we highlight a single connection between the cause and effect for clarity - but all such links should be supported.
Important Note: not all deduced alarms are caused by the trigger - the trigger might only be an indication of correlation, not causation. In the case we are examining, however, the trigger alarm is also the cause:
Once the local "causes" links (one hop) are detected and registered, we can follow them one hop after another to track the full causal chain of a sequence of events.
Demos and Presentations
Quick Demos (A bit outdated)
- Vitrage Functionalities Overview
- Vitrage Get Topology Demo
- Vitrage Alarms Demo
- Vitrage Deduced Alarms and RCA Demo
Summit Sessions
OpenStack Austin, April 2016
- Project Vitrage How to Organize, Analyze and Visualize your OpenStack Cloud
- On the Path to Telco Cloud Openness: Nokia CloudBand Vitrage & OPNFV Doctor collaboration
OPNFV Berlin, June 2016
- Failure Inspection in Doctor utilizing Vitrage and Congress
- Doctor: fast and dynamic fault management in OpenStack (DOCOMO, NTT, NEC, Nokia, Intel) - Telecom TV
OpenStack Barcelona, October 2016
- OpenStack Keynotes demo with Doctor - Keeping Your Mobile Phone Calls Connected
- Root Cause Analysis Principles and Practice in OpenStack and Beyond
- Fault Management with OpenStack Congress and Vitrage Based on OPNFV Doctor Framework
OpenStack Boston, May 2017
- Beyond Automation - Taking Vitrage Into the Realm of Machine Learning
- Collectd and Vitrage Integration - An Eventful Presentation
- The Vitrage Story - From Nothing to the Big Tent
- Advanced Use Cases for Root Cause Analysis
- Project Update Vitrage
OpenStack Sydney, November 2017
OpenStack Vancouver, May 2018
- Closing the Loop: VNF end-to-end Failure Detection and Auto Healing
- Extend Horizon Headers for easy monitoring and fault detection - and more
- Vitrage - Project Update
- Proactive Root Cause Analysis with Vitrage, Kubernetes, Zabbix and Prometheus
Development (Blueprints, Roadmap, Design...)
- Vitrage Documentation
- Vitrage in StoryBoard:
- Road Map
- Source code:
Design Discussions
- Supporting Overlapping Templates
- Barcelona Design Summit
- Pike PTG
- Queens PTG
- Vancouver forum: Vitrage advanced use cases
- Vancouver forum: Vitrage RCA over Kubernetes
Communication and Meetings
Meetings
- Weekly on Wednesday at 0800 UTC in #openstack-meeting-4 at freenode
- Check Vitrage Meetings for more details
Contact Us
- IRC channel for regular daily discussions: #openstack-vitrage
- Use [Vitrage] tag for Vitrage emails on OpenStack Mailing List


