Monasca
Features
This section describes the overall features.
- A highly performant, scalable, reliable and fault-tolerant Monitoring as a Service (MONaaS) solution that scales to service provider metrics levels of metrics throughput. Performance, scalability and high-availability have been designed in from the start. Can process 100s of thousands of metrics/sec as well as offer data retention periods of greater than a year with no data loss while still processing interactive queries.
- Rest API for storing and querying metrics and historical information. Most monitoring solution use special transports and protocols, such as CollectD or NSCA (Nagios). In our solution, http is the only protocol used. This simplifies the overall design and also allows for a much richer way of describing the data via dimensions.
- Multi-tenant and authenticated. Metrics are submitted and authenticated using Keystone and stored associated with a tenant ID.
- Metrics defined using a set of (key, value) pairs called dimensions.
- Real-time thresholding and alarming on metrics.
- Compound alarms described using a simple expressive grammar composed of alarm sub-expressions and logical operators.
- Monitoring agent that supports a number of built-in system and service checks and also supports Nagios checks and statsd.
- Open-source monitoring solution built on open-source technologies.
Architecture
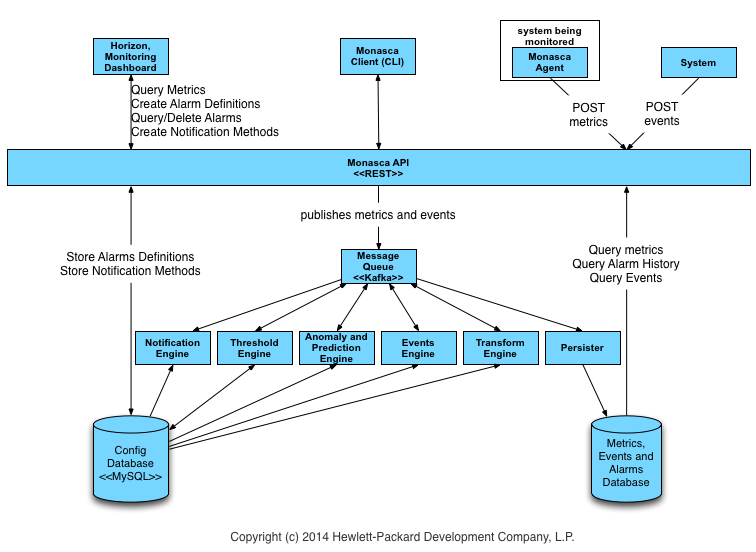
- Monitoring Agent (monasca-agent): A modern Python based monitoring agent that consists of several sub-components and supports system metrics, such as cpu utilization and available memory, Nagios plugins, statsd and many built-in checks for services such as MySQL, RabbitMQ, and many others.
- Monitoring API (monasca-api): A well-defined and documented RESTful API for monitoring that is primarily focused on the following concepts and areas:
- Metrics: Store and query massive amounts of metrics in real-time.
- Statistics: Query statistics for metrics.
- Alarms: Create, update, query and delete alarms and query the alarm history.
- Simple expressive grammar for creating compound alarms composed of alarm subexpressions and logical operators.
- Alarm state transitions are
- Alarm severities can be associated with alarms.
- The complete alarm state transition history is stored and queryable which allows for subsequent root cause anlaysis (RCA) or advanced analytics.
- Notification Methods: Create and delete notification methods and associate them with alarms, such as email. Supports the ability to notify users directly via email when an alarm state transitions occur.
- Persister (monasca-persister): Consumes metrics and alarm state transitions from the MessageQ and stores them in the Metrics and Alarms database. The Persister uses the Disruptor library, http://lmax-exchange.github.io/disruptor/. We will look into converting the Persister to a Python component in the future.
- Transform and Aggregation Engine: Transform metric names and values, such as delta or time-based derivative calculations, and creates new metrics that are published to the Message Queue. The Transform Engine is not available yet.
- Anomaly and Prediction Engine: Evaluates prediction and anomalies and generates predicted metrics as well as anomaly likelihood and anomaly scores.
- Threshold Engine (monasca-thresh): Computes thresholds on metrics and publishes alarms to the MessageQ when exceeded. Based on Apache Storm a free and open distributed real-time computation system.
- Notification Engine (monasca-notification): Consumes alarm state transition messages from the MessageQ and sends notifications, such as emails for alarms. The Notification Engine is Python based.
- Message Queue: A third-party component that primarily receives published metrics from the Monitoring API and alarm state transition messages from the Threshold Engine that are consumed by other components, such as the Persister and Notification Engine. The Message Queue is also used to publish and consume other events in the system. Currently, a Kafka based MessageQ is supported. Kafka is a high performance, distributed, fault-tolerant, and scalable message queue with durability built-in. We will look at other alternatives, such as RabbitMQ and in-fact in our previous implementation RabbitMQ was supported, but due to performance, scale, durability and high-availability limitiations with RabbitMQ we have moved to Kafka.
- Metrics and Alarms Database: A third-party component that primarily stores metrics and the alarm state history. Currently, Vertica is supported and development for InfluxDB is in progress.
- Config Database: A third-party component that stores a lot of the configuration and other information in the system. Currently, MySQL is supported.
- Monitoring Client (python-monascaclient): A Python command line client and library that communicates and controls the Monitoring API. The Monitoring Client was written using the OpenStack Heat Python client as a framework. The Monitoring Client also has a Python library, "monascaclient" similar to the other OpenStack clients, that can be used to quickly build additional capabilities. The Monitoring Client library is used by the Monitoring UI, Ceilometer publisher, and other components.
- Alarm Configuration Manager: A Python process that will detect new metrics and configure alarms based on the configuration. It uses the monitoring client library that communicates with the Monitoring API. The Alarm Configuration Manager is a Python Daemon that runs on a configurable interval and detects new metrics that need to be alarmed and creates the alarms.
- Monitoring UI: A Horizon dashboard for visualizing the overall health and status of an OpenStack cloud.
- Ceilometer publisher: A multi-publisher plugin for Ceilometer, not shown, that converts and publishes samples to the Monitoring API.
Most of the components are described in their respective repositories. However, there aren't any repositories for the third-party components used, so we describe some of the relevant details here.
- Messages
There are several messages that are published and consumed by various components in the monitoring system via the MessageQ.
| Message | Produced By | Consumed By | Kafka Topic | Description | |---------|------------|-------------|-------------|-------------| | Metric | API, Transform and Aggregation Engine | Persister, Threshold Engine | metrics | A metric sent to the Monitoring API or created by the Transform and Aggregation Engine is published to the MessageQ. | | Alarm Definition Event | API | Threshold Engine | events | When an alarm is created, updated, or deleted by the monitoring API an Alarm Definition Event is published to the MessageQ. | |Alarm State Transitioned | Threshold Engine | Notification Engine, Persister | alarm-state-transitions | When an alarm transitions from the OK to Alarmed, Alarmed to OK, ..., this event is published to the MessageQ and persisted by the persister and processed by the Notification Engine. The Monitoring API can query the history of alarm state transition events. | | Alarm Notification | Notification Engine | Persister | alarm-notifications | This event is published to the MessageQ when the notification engine processes an alarm and sends a notification. The alarm notification is persisted by the Persister and can be queried by the Monitoring API. The database maintains a history of all events.
Metrics and Alarms Database
A high-performance analytics database that can store massive amounts of metrics and alarms in real-time and also support interactive queries. Currently Vertica and InfluxDB are supported.
The SQL schema is as follows:
- MonMetrics.Measurements: Stores the actual measurements that are sent.
- id: An integer ID for the measurement.
- definition_dimensions_id: A reference to DefinitionDimensions.
- time_stamp
- value
- MonMetrics.DefinitionDimensions
- id: A sha1 hash of (defintion_id, dimension_set_id)
- definition_id: A reference to the Definitions.id
- dimension_set_id: A reference to the Dimensions.dimension_set_id
- MonMetrics.Definitions
- id: A sha1 hash of the (name, tenant_id, region)
- name: Name of the metric.
- tenant_id: The tenant_id that submitted the metric.
- region: The region the metric was submitted under.
- MonMetric.Dimensions
- dimension_set_id: A sha1 hash of the set of dimenions for a metric.
- name: Name of dimension.
- value: Value of dimension.
Post Metric Sequence
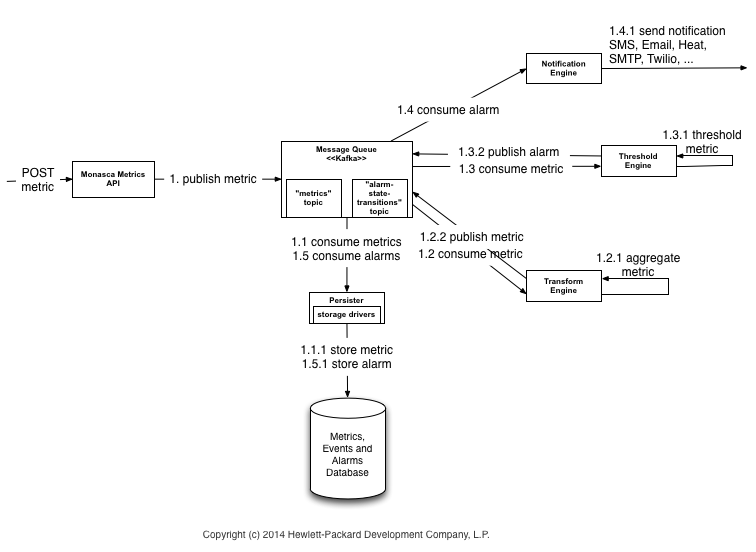
This section describes the sequence of operations involved in posting a metric to the Monasca API.
- A metric is posted to the Monasca API.
- The Monasca API authenticates and validates the request and publishes the metric to the the Message Queue.
- The Persister consumes the metric from the Message Queue and stores in the Metrics Store.
- The Transform Engine consumes the metrics from the Message Queue, performs transform and aggregation operations on metrics, and publishes metrics that it creates back to Message Queue.
- The Threshold Engine consumes metrics from the Message Queue and evaluates alarms. If a state change occurs in an alarm, an "alarm-state-transitioned-event" is published to the Message Queue.
- The Notification Engine consumes "alarm-state-transitioned-events" from the Message Queue, evaluates whether they have a Notification Method associated with it, and sends the appropriate notification, such as email.
- The Persister consumes the "alarm-state-transitioned-event" from the Message Queue and stores it in the Alarm State History Store.


