Difference between revisions of "MONaaS"
(→Monitoring as a Service (blueprint)) |
|||
| (6 intermediate revisions by one other user not shown) | |||
| Line 1: | Line 1: | ||
== Monitoring as a Service ([https://blueprints.launchpad.net/ceilometer/+spec/monitoring-as-a-service blueprint]) == | == Monitoring as a Service ([https://blueprints.launchpad.net/ceilometer/+spec/monitoring-as-a-service blueprint]) == | ||
| + | |||
| + | Take a look at the [https://etherpad.openstack.org/p/MONaaS Etherpad]! | ||
'''Problem to solve''': Ceilometer's purpose is to track and *measure/meter* usage information collected from OpenStack components (originally for billing). While Ceilometer is usefull for the cloud operators and infrastructure metering, it is not a *monitoring* solution for the tenants and their services/applications running in the cloud because it does not allow for service/application-level monitoring and it ignores detailed and precise guest system metrics. | '''Problem to solve''': Ceilometer's purpose is to track and *measure/meter* usage information collected from OpenStack components (originally for billing). While Ceilometer is usefull for the cloud operators and infrastructure metering, it is not a *monitoring* solution for the tenants and their services/applications running in the cloud because it does not allow for service/application-level monitoring and it ignores detailed and precise guest system metrics. | ||
| − | '''Proposed solution''': We would like to add Monitoring as a Service to OpenStack | + | '''Proposed solution''': We would like to add Monitoring as a Service to OpenStack Telemetry |
| − | Just like Rackspace's Cloud monitoring, the new monitoring service | + | Just like Rackspace's Cloud monitoring, the new monitoring service would let users/tenants keep track of their ressources on the cloud and receive instant notifications when they require attention. |
This RESTful API would enable users to create multiple monitors with predefined checks, such as PING, CPU usage, HTTPS and SMTP or custom checks performed by a Monitoring Agent on the instance they want to monitor. | This RESTful API would enable users to create multiple monitors with predefined checks, such as PING, CPU usage, HTTPS and SMTP or custom checks performed by a Monitoring Agent on the instance they want to monitor. | ||
| Line 11: | Line 13: | ||
Predefined checks such as CPU and disk usage could be polled from Ceilometer. Other predefined checks would be performed by the new monitoring service itself. Checks such as PING could be flagged to be performed from multiple sites. | Predefined checks such as CPU and disk usage could be polled from Ceilometer. Other predefined checks would be performed by the new monitoring service itself. Checks such as PING could be flagged to be performed from multiple sites. | ||
| − | Custom checks | + | Custom checks would be performed by an optional Monitoring Agent. Their results would be polled by the monitoring service and stored in a backend (could be Ceilometer). |
The project would start with API functions. In the future, it could be integrated into Horizon with statistics and graph functionalities. | The project would start with API functions. In the future, it could be integrated into Horizon with statistics and graph functionalities. | ||
| Line 23: | Line 25: | ||
'''Ressources''': | '''Ressources''': | ||
| − | + | Rackspace Cloud monitoring: https://monitoring.api.rackspacecloud.com/ | |
| + | |||
| + | Rackspace Monitoring Agent : https://github.com/virgo-agent-toolkit/rackspace-monitoring-agent | ||
| − | Rackspace | + | Rackspace Monitoring Agent Plugins : https://github.com/racker/rackspace-monitoring-agent-plugins-contrib |
Nagios Ceilometer plugin: http://blog.zhaw.ch/icclab/nagios-ceilometer-integration-new-plugin-available/ | Nagios Ceilometer plugin: http://blog.zhaw.ch/icclab/nagios-ceilometer-integration-new-plugin-available/ | ||
| + | |||
| + | Nagios: http://www.nagios.org/ | ||
| + | |||
| + | Shinken: http://www.shinken-monitoring.org/ | ||
| + | |||
| + | Amazon CloudWatch: http://aws.amazon.com/fr/cloudwatch/ | ||
| + | |||
| + | AWS CloudWatch command line : http://docs.aws.amazon.com/AmazonCloudWatch/latest/cli/cli-mon-put-data.html | ||
| + | |||
| + | Zabbix agent adoption mechanism: https://wiki.openstack.org/wiki/Zabbix-agent-adoption | ||
| + | |||
| + | HP Jahmon: https://github.com/hpcloud-mon | ||
Latest revision as of 17:59, 23 May 2014
Monitoring as a Service (blueprint)
Take a look at the Etherpad!
Problem to solve: Ceilometer's purpose is to track and *measure/meter* usage information collected from OpenStack components (originally for billing). While Ceilometer is usefull for the cloud operators and infrastructure metering, it is not a *monitoring* solution for the tenants and their services/applications running in the cloud because it does not allow for service/application-level monitoring and it ignores detailed and precise guest system metrics.
Proposed solution: We would like to add Monitoring as a Service to OpenStack Telemetry
Just like Rackspace's Cloud monitoring, the new monitoring service would let users/tenants keep track of their ressources on the cloud and receive instant notifications when they require attention.
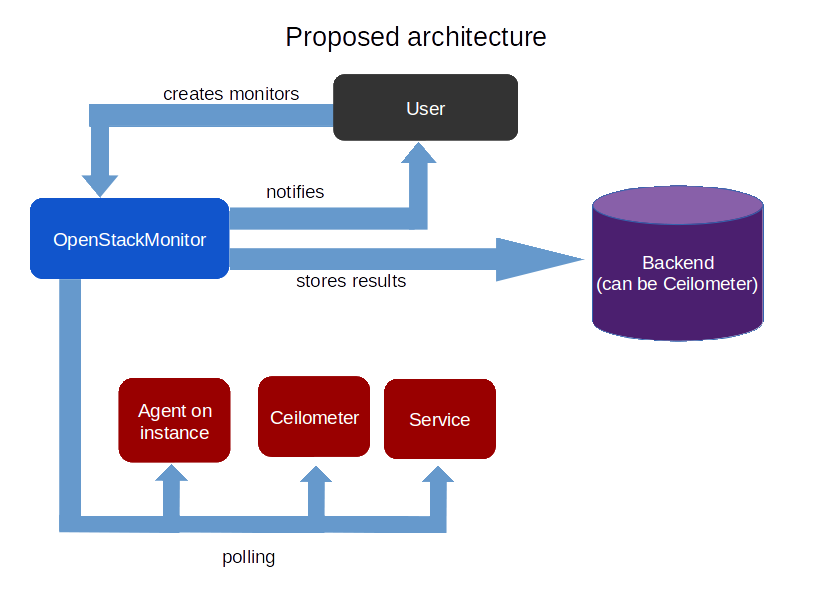
This RESTful API would enable users to create multiple monitors with predefined checks, such as PING, CPU usage, HTTPS and SMTP or custom checks performed by a Monitoring Agent on the instance they want to monitor.
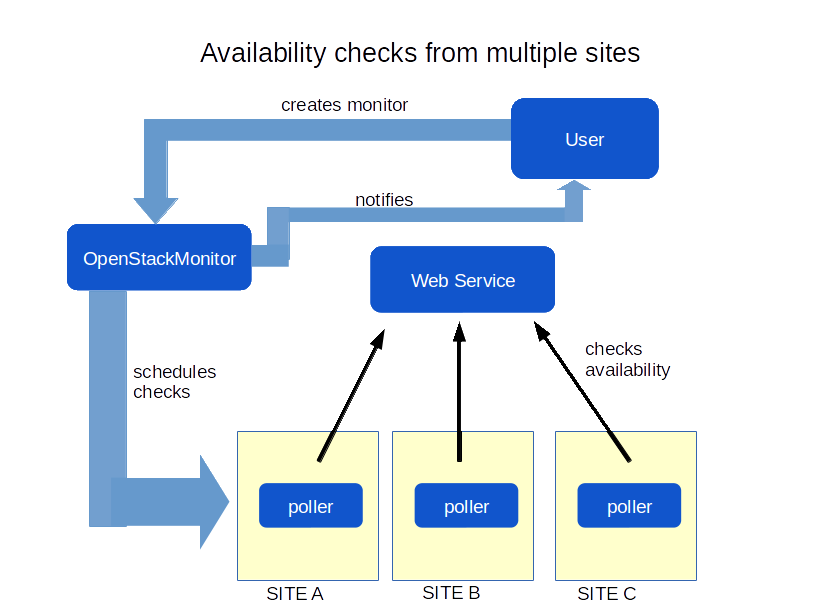
Predefined checks such as CPU and disk usage could be polled from Ceilometer. Other predefined checks would be performed by the new monitoring service itself. Checks such as PING could be flagged to be performed from multiple sites.
Custom checks would be performed by an optional Monitoring Agent. Their results would be polled by the monitoring service and stored in a backend (could be Ceilometer).
The project would start with API functions. In the future, it could be integrated into Horizon with statistics and graph functionalities.
Schemes:
Ressources:
Rackspace Cloud monitoring: https://monitoring.api.rackspacecloud.com/
Rackspace Monitoring Agent : https://github.com/virgo-agent-toolkit/rackspace-monitoring-agent
Rackspace Monitoring Agent Plugins : https://github.com/racker/rackspace-monitoring-agent-plugins-contrib
Nagios Ceilometer plugin: http://blog.zhaw.ch/icclab/nagios-ceilometer-integration-new-plugin-available/
Nagios: http://www.nagios.org/
Shinken: http://www.shinken-monitoring.org/
Amazon CloudWatch: http://aws.amazon.com/fr/cloudwatch/
AWS CloudWatch command line : http://docs.aws.amazon.com/AmazonCloudWatch/latest/cli/cli-mon-put-data.html
Zabbix agent adoption mechanism: https://wiki.openstack.org/wiki/Zabbix-agent-adoption
HP Jahmon: https://github.com/hpcloud-mon


