Difference between revisions of "Ceilometer/blueprints/graphite-publisher"
< Ceilometer | blueprints
Shashi Dahal (talk | contribs) |
Shashi Dahal (talk | contribs) |
||
| Line 1: | Line 1: | ||
| − | |||
== '''Context''' == | == '''Context''' == | ||
We want to monitor resource usage for all the VMS group by tenants. We do not want to write our own plugin for monitoring, but use ceilometer. | We want to monitor resource usage for all the VMS group by tenants. We do not want to write our own plugin for monitoring, but use ceilometer. | ||
| Line 18: | Line 17: | ||
<big>ceilometer.project_id.resource_id.metric</big> | <big>ceilometer.project_id.resource_id.metric</big> | ||
| − | [[File:Ceilometer graphite publisher.png| | + | [[File:Ceilometer graphite publisher.png|framed|center|Ceilometer Graphite Publisher]] |
Revision as of 11:28, 1 April 2014
Context
We want to monitor resource usage for all the VMS group by tenants. We do not want to write our own plugin for monitoring, but use ceilometer. So instead of installing the full ceilometer components, we can install just the ceilometer-compute agent on each hypervisor, and then use the pipeline.yaml file to send the collected stats directly to graphite.
Problem
Performance issues on saving records to sql and on query.
Solution
To create a new graphite publisher, so that ceilometer-compute agent can directly send the metrics to graphite.
In publisher.yaml:
   publishers:
       - graphite://127.0.0.1:2003
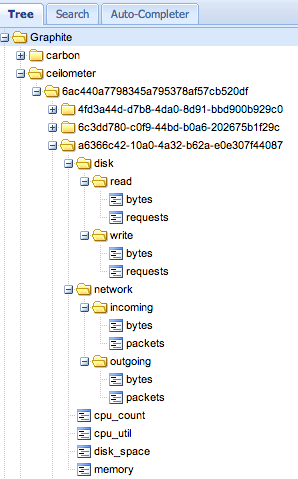
Working Sample. The metrics are send to graphite as: ceilometer.project_id.resource_id.metric

