Difference between revisions of "2016-05-23"
(→Forecast) |
|||
| Line 5: | Line 5: | ||
<sup>1.</sup> Can potentially include obsoleted or non-impactful tasks. | <sup>1.</sup> Can potentially include obsoleted or non-impactful tasks. | ||
| − | === Forecast === | + | === Monte Carlo Forecast === |
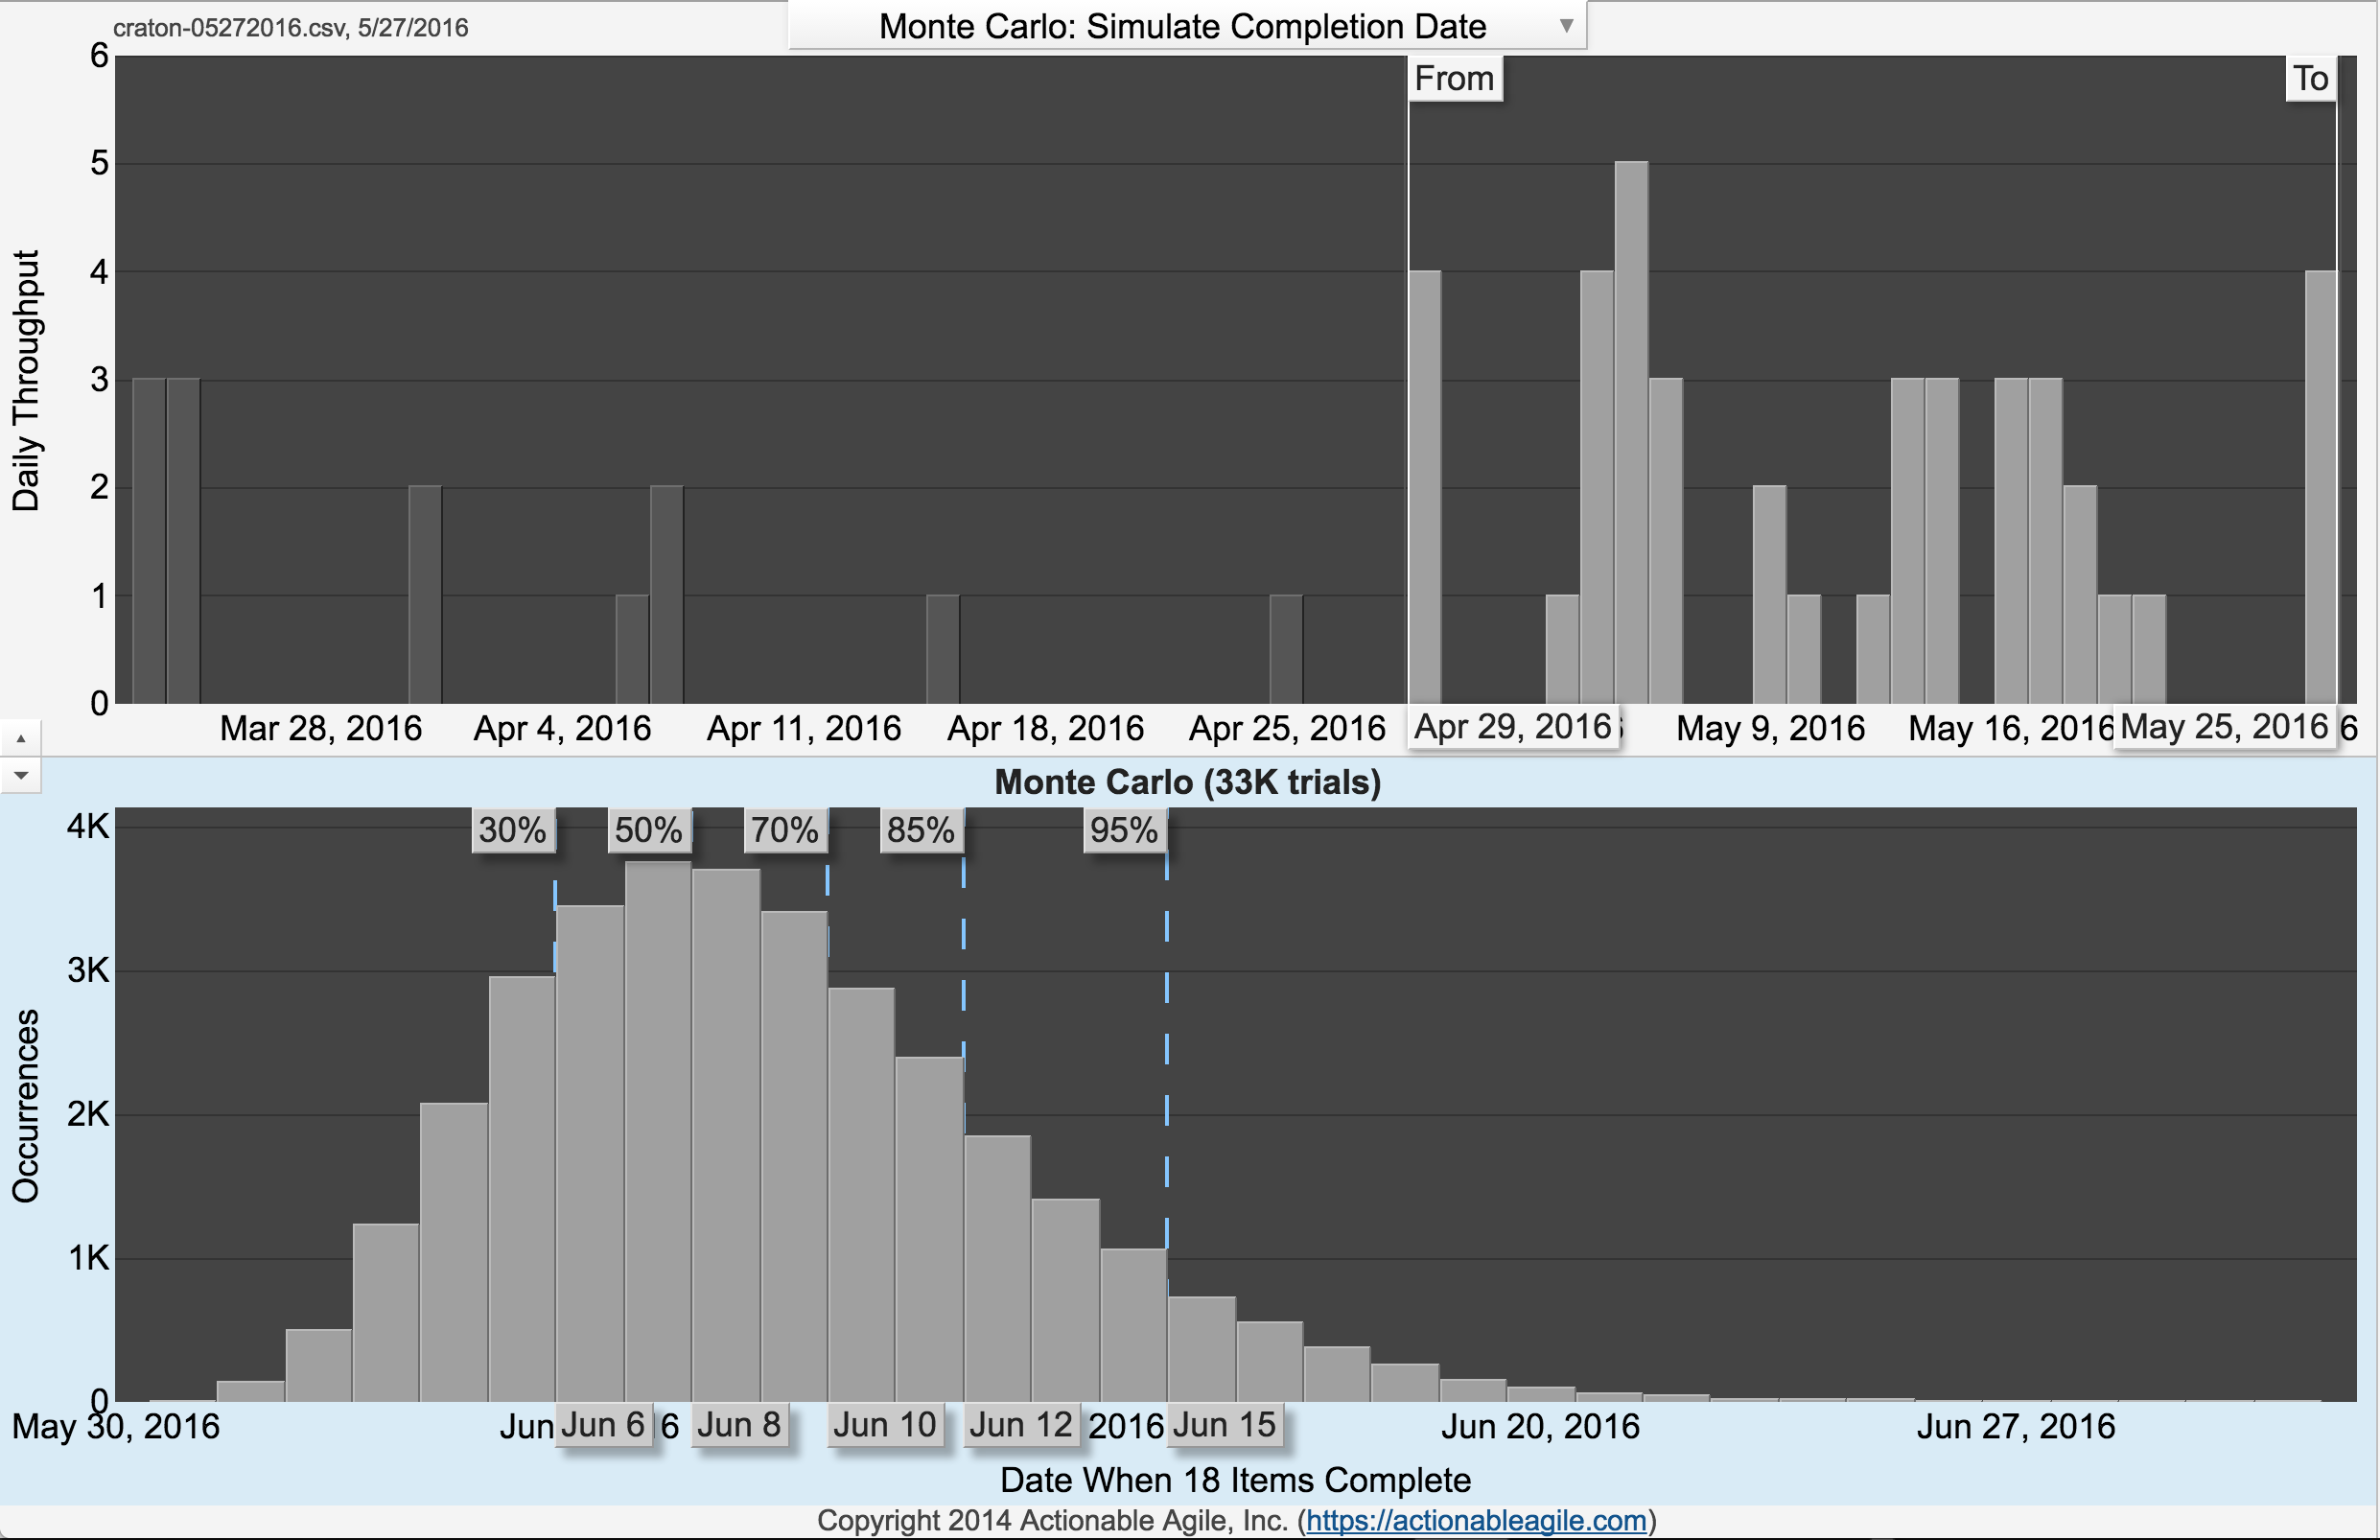
Based on our progress up to this point, a throughput rate of 0.82 tasks per day, and 18 remaining tasks, we are projecting a completion of on or about 2016-06-10. This forecast date falls within 80.1% of trials (based on a sample size of 4k trials). This forecast date will be revised based on increases or decreases to scope and changes to the throughput rate. | Based on our progress up to this point, a throughput rate of 0.82 tasks per day, and 18 remaining tasks, we are projecting a completion of on or about 2016-06-10. This forecast date falls within 80.1% of trials (based on a sample size of 4k trials). This forecast date will be revised based on increases or decreases to scope and changes to the throughput rate. | ||
Latest revision as of 01:56, 31 May 2016
Contents
TL;DR
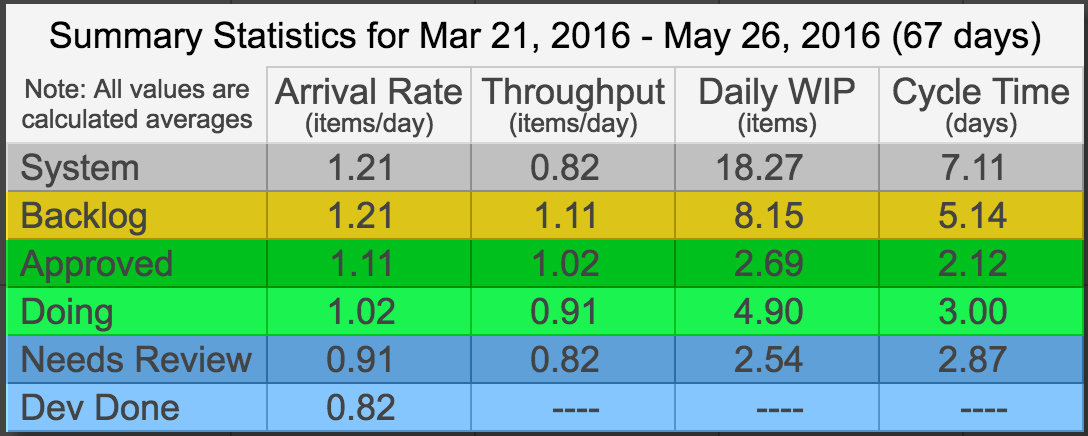
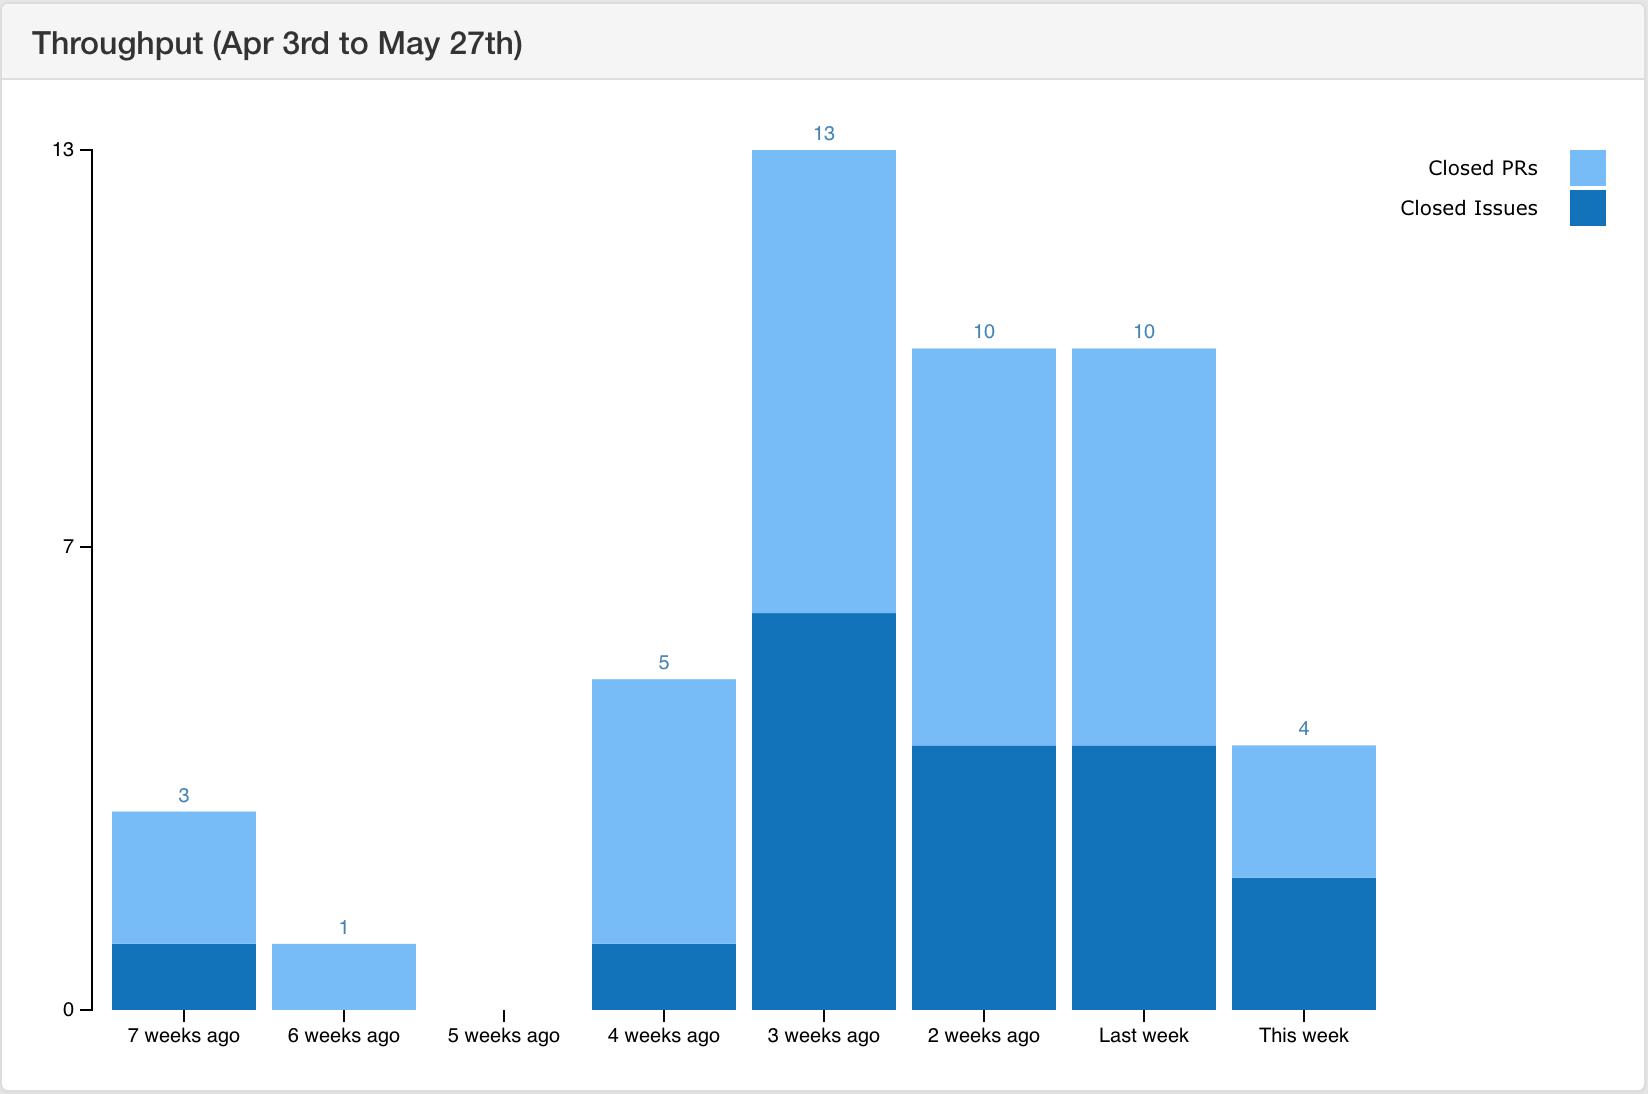
The number of Craton tasks completed this week1 (2016-05-23 to 2016-05-29) is 4 (a decrease of 6 from the previous week). 7 tasks were added this week. The arrival rate is 1.21 tasks per day (a decrease of 0.01 from last week); the throughput rate (completed tasks) is 0.82 tasks per day (a decrease of 0.01 from the previous week). The cycle time (number of days to complete a task from when it was created to when it is development done) is 7.11 days (a decrease of 0.07 from the previous week).
1. Can potentially include obsoleted or non-impactful tasks.
Monte Carlo Forecast
Based on our progress up to this point, a throughput rate of 0.82 tasks per day, and 18 remaining tasks, we are projecting a completion of on or about 2016-06-10. This forecast date falls within 80.1% of trials (based on a sample size of 4k trials). This forecast date will be revised based on increases or decreases to scope and changes to the throughput rate.
Summary statistics
Completed issues per week
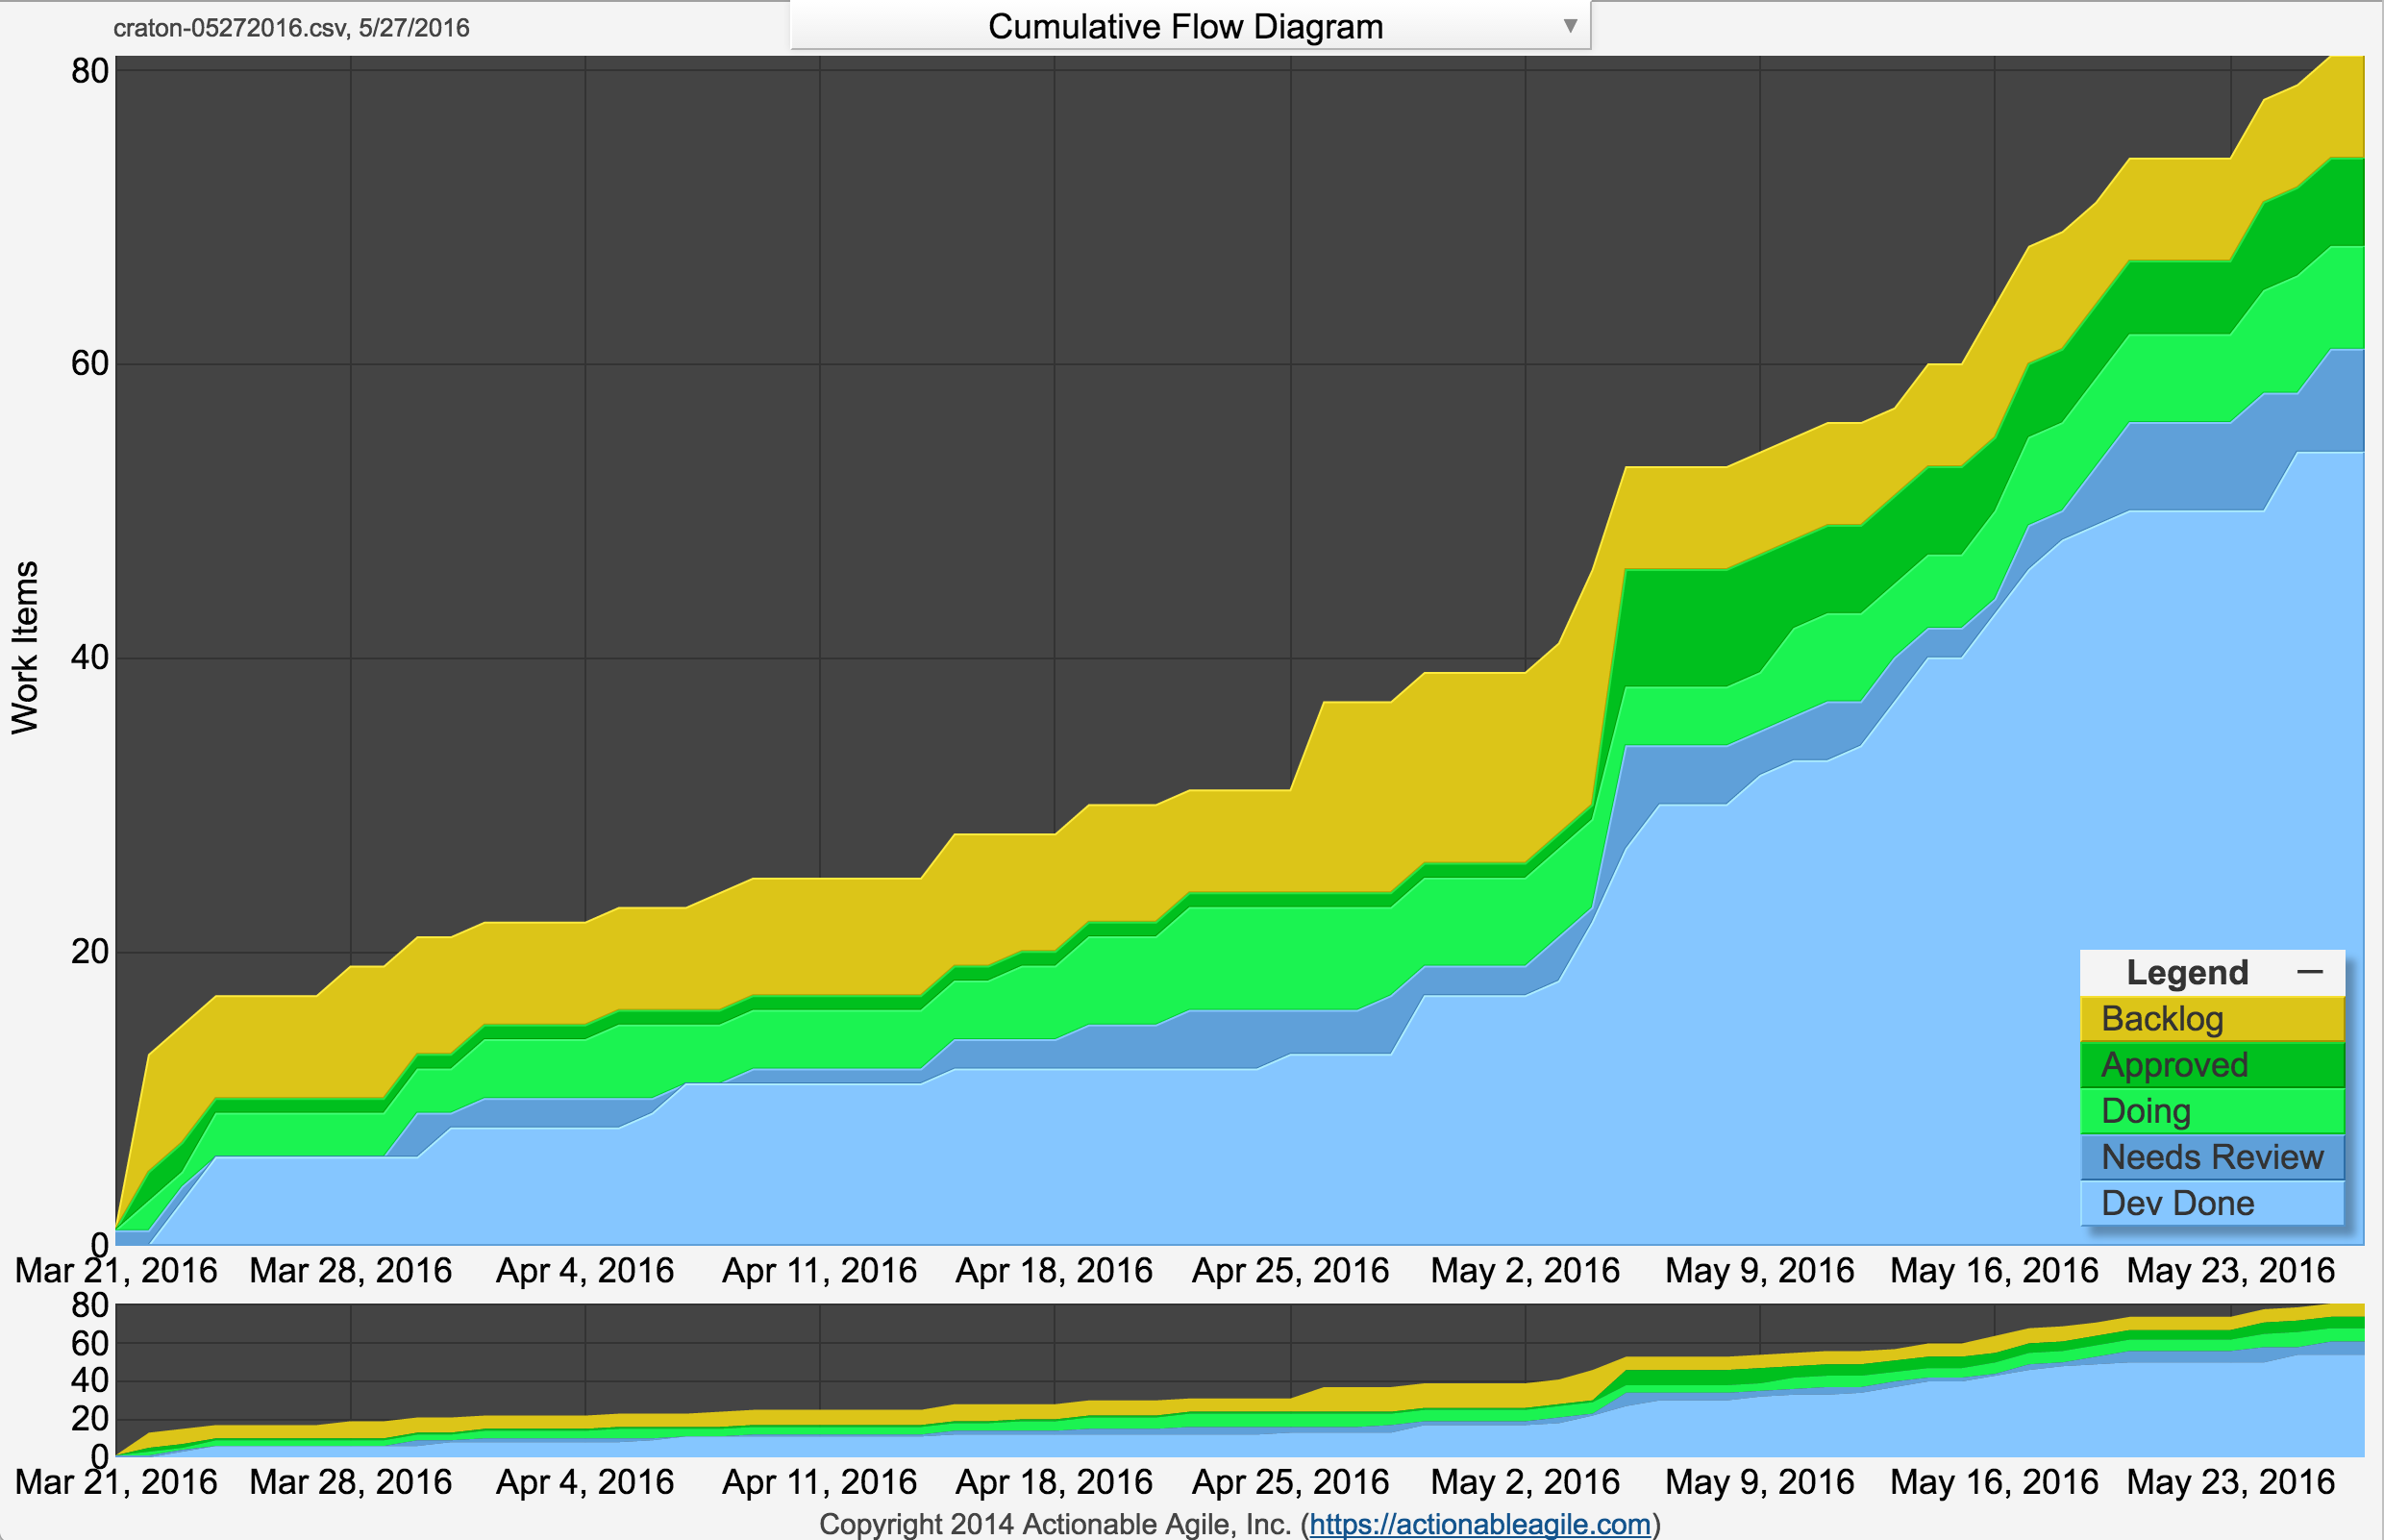
Cumulative flow diagram (CFD)
Source Kanban board
Issues location
Source CSV file
N/A
Archives
N/A


